
In a significant turn of events, Bitcoin soared to near two-week highs yesterday, driven by the news of Grayscale, a prominent digital asset management firm, winning a lawsuit against U.S. regulators. The victory upended the stagnant Bitcoin trading environment that had persisted following abrupt losses earlier in the month. The ruling by the United States Court of Appeals for the District of Columbia Circuit questioned the U.S. Securities and Exchange Commission's (SEC) decision to reject Grayscale's proposal to launch a Bitcoin-based exchange-traded fund (ETF). This landmark decision has sparked hope within the cryptocurrency community and set the stage for potential shifts in the market.
This positive development resulted in BTC breaking above the $27K threshold throughout the past 24 hours. If this bullish momentum continues, then the market leader’s price could soar to $30K in the coming 2 weeks. On the other hand, the market leader’s price could pullback to a key support level before potentially entering into another leg up if traders take profit within the coming 24-48 hours.
Grayscale's Triumph
The Court's decision, as summarized in an unverified copy circulating online, declared that the SEC's denial of Grayscale's ETF proposal was "arbitrary and capricious" due to the regulator's failure to justify its differing treatment of similar products. As a result, the Court granted Grayscale's petition and vacated the previous order, effectively giving the digital asset manager an opportunity to join the list of firms aspiring to launch the first U.S.-based Bitcoin spot ETF. It is, however, important to note that the SEC has yet to approve any ETF applications related to Bitcoin.
Market Reaction and Analysis
The news had an immediate impact on the market, as evidenced by data from the Binance BTC/USD order book uploaded to the social media platform X by Material Indicators. The uptick in Bitcoin's price prompted an increase in buying across all order classes. This surge was particularly significant given the market's recent lack of liquidity and the cautious trading environment that emerged after mid-August losses.
The analysis of the market conditions, issued just prior to the Grayscale announcement, revealed that while there was potential for a retest of the $30,000 range due to thin liquidity, market sentiment remained cautious. Investors were concerned about the possibility of Bitcoin printing lower lows, which contributed to the hesitation in taking more aggressive positions.
Implications for the Market and Industry
Michaël van de Poppe, the founder and CEO of trading firm Eight, offered an intriguing perspective on the Court's decision. He suggested that this development could mark the beginning of a new bull cycle for Bitcoin. This sentiment was shared with his followers on platform X through a dedicated video update.
Additionally, industry experts have pointed out that Grayscale's legal battle with the SEC has been a protracted and deliberate process. The firm's CEO, Michael Sonnenshein, had made it clear that Grayscale would persist in seeking permission to convert its existing Bitcoin investment vehicle, the Grayscale Bitcoin Trust (GBTC), into an ETF. The Court's decision, therefore, represents a significant step towards achieving this goal.
Michael Saylor Highlights Key Indicator for BTC
Meanwhile, Michael Saylor, the CEO of MicroStrategy and a prominent advocate for Bitcoin, has recently drawn attention to an intriguing aspect of Bitcoin's price behavior. His observation, highlighting Bitcoin's tendency to rarely trade below its 200-week Moving Average (WMA), has sparked discussions in the cryptocurrency community. While this historical trend does offer insights, it is crucial to consider the evolving dynamics of the cryptocurrency market and the broader context in which Bitcoin operates.
The 200-week EMA and Historical Data
Saylor's assertion regarding Bitcoin's trading pattern relative to its 200-week Exponential Moving Average (EMA) is rooted in historical data. This long-term trend indicator has historically proven to be significant for Bitcoin. The general trend has shown that when Bitcoin's price dips below its 200-week EMA, it often rebounds, suggesting that such moments could present favorable entry points for investors seeking to capitalize on potential price gains.
Evolving Market Dynamics
However, the cryptocurrency market has undergone significant transformations since its early days. Increased volatility, growing institutional participation, wider adoption, and the integration of blockchain technology across industries have reshaped the market's dynamics. While the historical reliability of the 200-week EMA is noteworthy, it is important to consider how these shifts might impact its predictive power moving forward.
Institutional Influence and Mainstream Adoption
The influx of institutional investors into the cryptocurrency space has introduced new variables. This is due to the fact that institutions bring significant capital and sophisticated trading strategies that can either stabilize prices or introduce higher levels of volatility. Moreover, as Bitcoin gains acceptance within mainstream finance, its price behavior could become more intertwined with traditional financial markets, potentially influencing its correlation patterns.
The Limitations of Singular Indicators
While the 200-week EMA has demonstrated its value, it is essential to exercise caution in relying solely on a single indicator for making investment decisions. The cryptocurrency market is multifaceted and influenced by numerous factors, including regulatory developments, technological advancements, macroeconomic trends, and shifts in investor sentiment. These variables can swiftly alter market conditions and render any single indicator less effective.
Diversification and Informed Decision-Making
Michael Saylor's emphasis on the 200-week EMA offers a valuable perspective, but it should be part of a broader toolkit. To make well-informed investment choices, market participants should combine various metrics, technical and fundamental analyses, and expert opinions. Diversification across assets and strategies can also help mitigate risks associated with relying solely on a single indicator.
Technical Overview
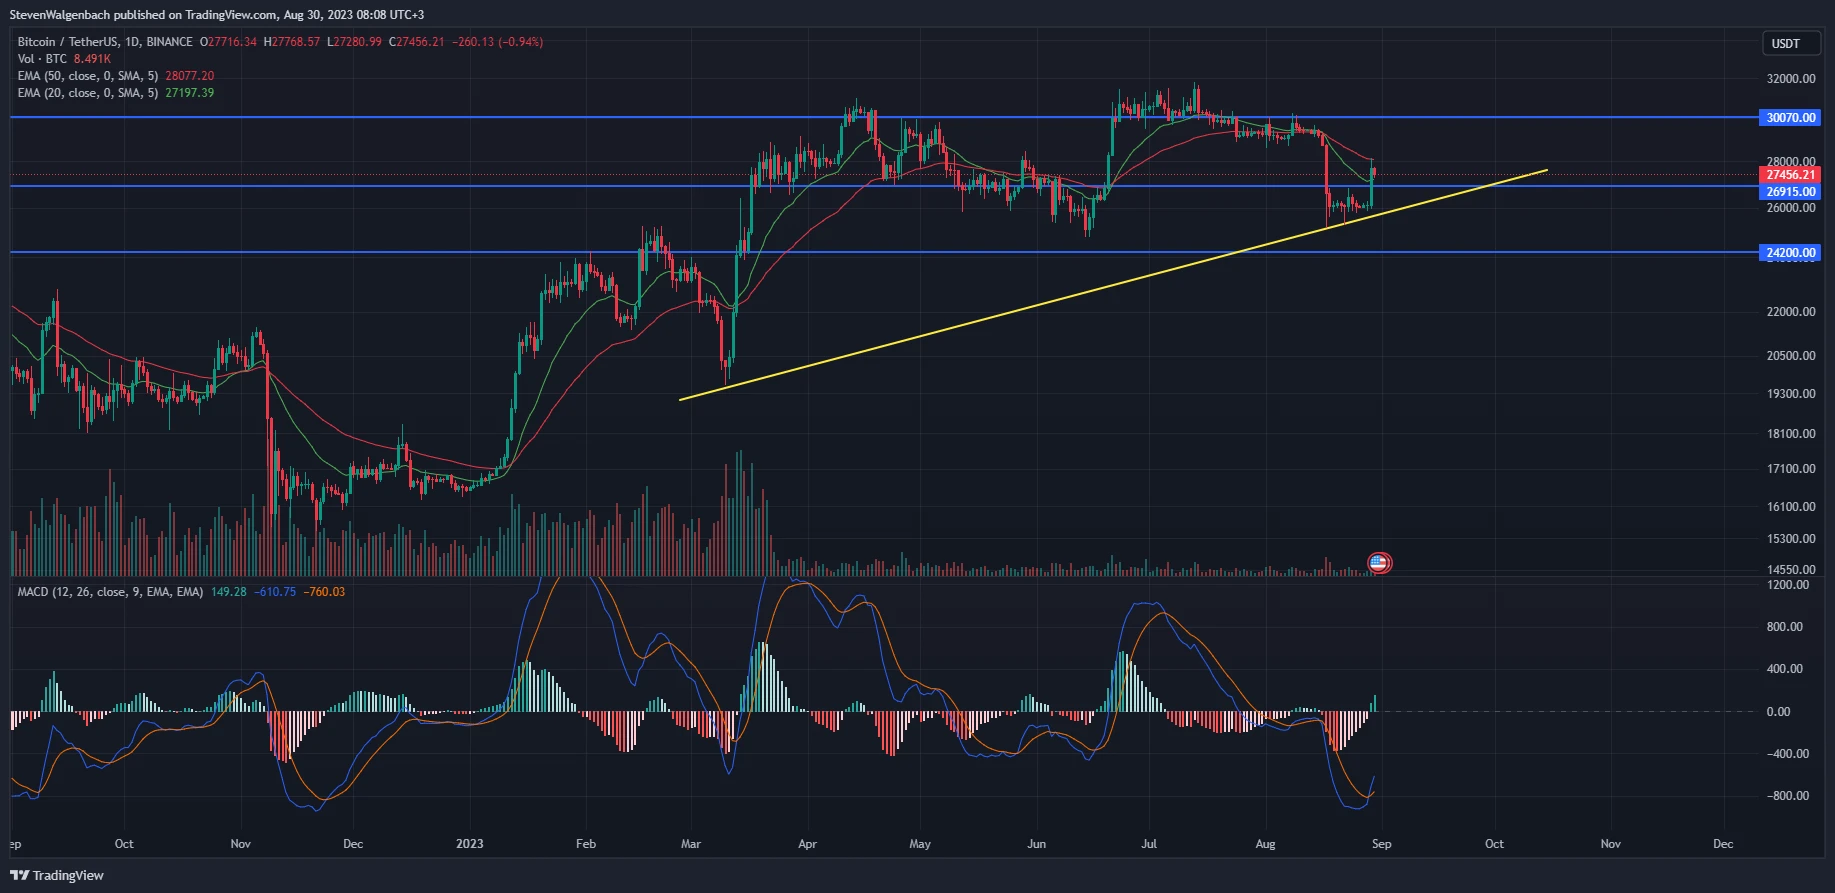
Daily chart for BTC/USDT (Source: TradingView)
BTC was able to break above the $26,915 resistance level over the past 24 hours, where it continued to trade at press time. Furthermore, the latest spike in the market leader’s price resulted in a new higher low being recorded. Subsequently, a positive trend line had been established on the cryptocurrency’s daily chart, which may suggest that BTC’s price could continue to climb in the coming few days.
A potential confirmation of this bullish thesis will be if BTC closes today’s daily candle above the 20-day EMA line at around $27,198.22. Should the market leader succeed in this regard, then it could attempt to challenge the $28K level, which was also around the same level as the 50-day EMA line, within the next 24-72 hours. A break above this level will then clear a path for BTC to rise to $30,070 in the following week.
On the other hand, BTC failing to close today’s daily candle above the 20-day EMA line will put the cryptocurrency at risk of testing the previously-mentioned $26,915 mark. If traders begin to take profit at this point, then the leading cryptocurrency’s price will most likely seek support from the positive trend line on its daily chart. Thereafter, BTC’s price could either enter into another leg up or continue to drop to the crucial support level at $24,200 in the following 2 weeks.
Investors and traders will want to take note of the fact that a bullish technical flag was triggered on BTC’s daily chart throughout the past 24 hours. During this period, the MACD line crossed above the MACD signal line - indicating that BTC may be in the process of reversing its negative trend.
Price Overview
At press time, data from CoinStats indicated that BTC was changing hands at $27,458.13. This was after the largest cryptocurrency by market cap achieved a 24-hour gain of 5.29%. Moreover, the positive daily performance boosted BTC’s weekly price movement to +5.42%.
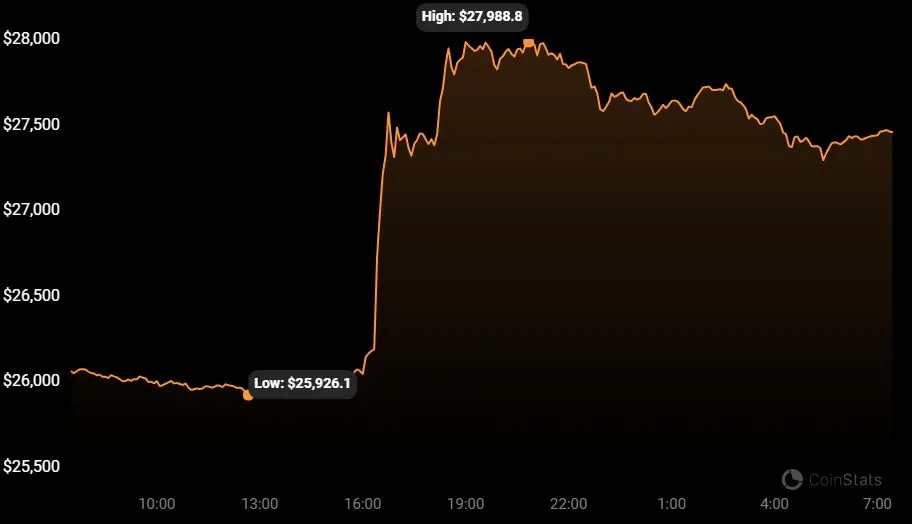
Price chart for BTC (Source: CoinStats)
Although BTC’s weekly and daily performances were in the green zone, it still had some work to do to flip its negative monthly performance. At press time, the market leader’s price was still down 6% over the past 30 days.
Disclaimer: Coinpaper does not recommend that any cryptocurrency should be bought, sold, or held by you. Always conduct your own research and consult your financial advisor before investing in any digital asset.
