
The cryptocurrency market suffered an onslaught during the past 24 hours. As a market wide selloff ensued, the collective market capitalizations of all cryptocurrencies plummeted more than 7%. Consequently, the total was estimated to be $1.05 trillion at press time according to CoinMarketCap.
All of the top 10 cryptocurrencies were overcome by the wave of sell volume, with many printing daily losses of more than 5%. In the list, Bitcoin (BTC), Ripple (XRP) and Dogecoin (DOGE) were the biggest losers.
The latest market selloff also resulted in a vast amount of traders being liquidated over the past day of trading. BTC and Ethereum (ETH) Futures traders were hit the hardest, as their combined liquidations total several million dollars.
XRP, BTC and DOGE Prices Are Hit the Hardest
Ripple (XRP)
The biggest loser in the top 10 cryptocurrencies list is XRP, as the remittance token’s price dropped nearly 17% during the past 24 hours. CoinMarketCap also indicated that the negative daily performance had forced XRP’s weekly performance further into the red zone, pushing the total weekly loss to -22.75%. Consequently, the altcoin’s price stood at $0.4918 at press time.
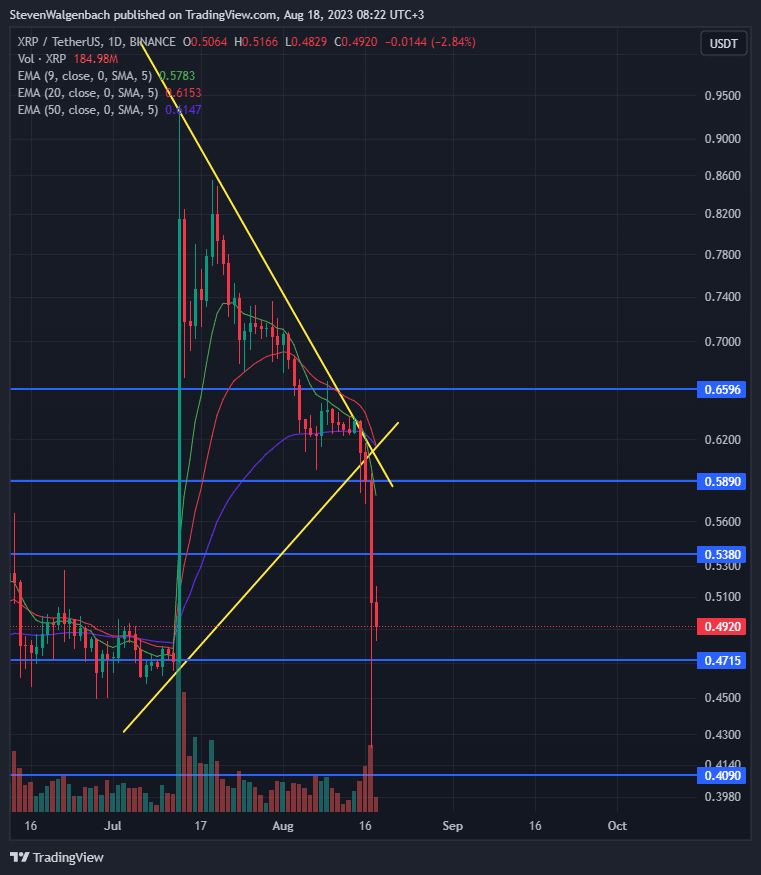
Daily chart for XRP/USDT (Source: TradingView)
The symmetrical triangle chart pattern that had formed on XRP’s daily chart played out over the past 48 hours. This resulted in the cryptocurrency’s price dropping below multiple key support levels during this time.
XRP’s price first lost the support of $0.5890 on Wednesday. It was yesterday, however, that the altcoin’s price was overcome by a 14+% move. The wave of sell volume that entered into XRP’s daily chart yesterday forced its price below the $0.5380 and $0.4715 support levels. Sellers attempted to do the same with the next crucial support level at $0.4090, but bulls were able to defend the mark - enabling XRP’s price to recover slightly to back above $0.4715, where it continued to trade at press time.
Traders and investors will want to take note of the fact that the 20-day EMA line recently crossed below the 50-day EMA line, which suggested that medium-term momentum had shifted in favor of bulls and that the altcoin’s price may continue to drop over the coming week.
Dogecoin (DOGE)
The largest meme coin by market cap, DOGE, also fell victim to the selloff that recently took place in the cryptocurrency market. According to CoinMarketCap, DOGE’s price had fallen 9.71% over the past 24 hours. Similar to XRP, the negative daily performance had dragged DOGE’s weekly performance further into the red zone to -18.65%. The latest price movement meant that DOGE was trading hands at $0.06145 at press time.
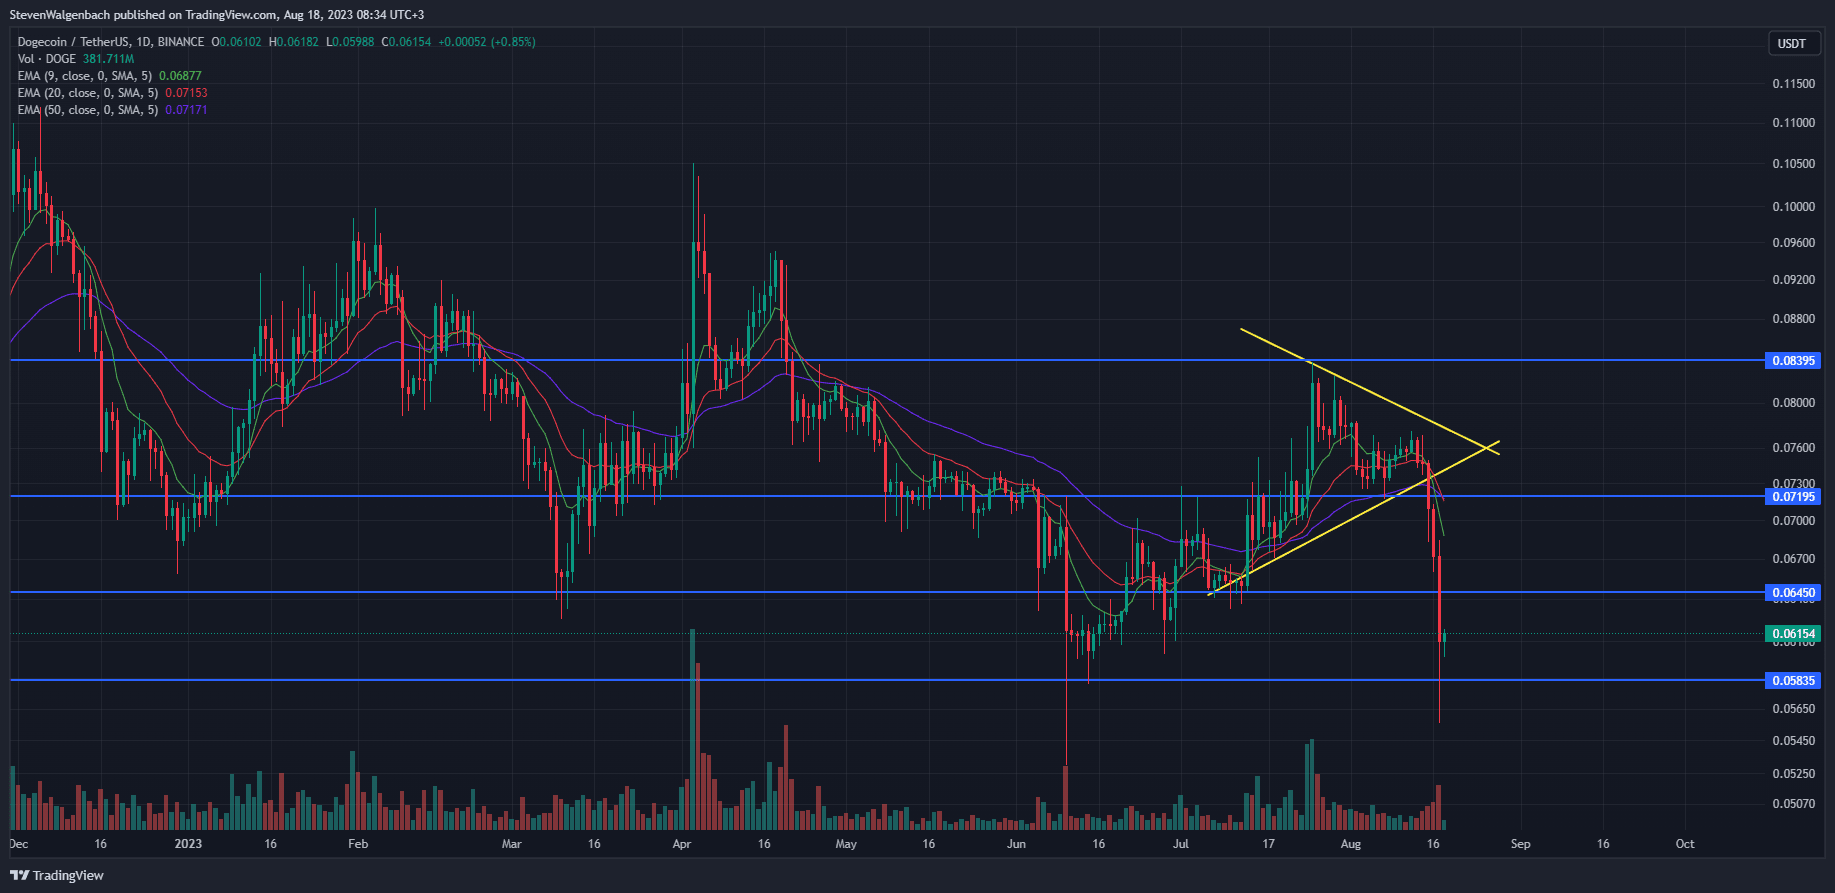
Daily chart for DOGE/USDT (Source: TradingView)
From a technical standpoint, altcoins appear to have recorded near-identical price movement in the previous 2 days of trading. Similar to XRP, a symmetrical triangle that had formed on its daily chart was validated - leading to a significant drop in the meme coin’s price. Following the break below this chart pattern, DOGE’s price breached the $0.07195 and $0.06450 support levels, and continued to trade below these price marks at press time.
Furthermore, the momentum from yesterday’s selloff had dragged DOGE’s price to below a third crucial support level at $0.05835 to reach a low yesterday of $0.05988. The same thing that happened with XRP happened with DOGE as well, as bulls stepped in to give the altcoin a much-needed boost to above the $0.05988 price point.
Technical indicators suggested that DOGE’s price may continue to fall in the next couple of days as well. At press time, the 9-day EMA line was positioned below the 20-day EMA line. Furthermore, both of these technical indicators were below the 50-day EMA line, after the 20 EMA had crossed bearishly below the 50 EMA yesterday. The orientation of these EMA lines suggested that DOGE was in a medium-term negative trend and momentum was in favor of bears.
Bitcoin (BTC)
At press time, CoinMarketCap indicated that BTC was changing hands at $26,310.54. This was after the leading cryptocurrency in terms of market capitalization suffered a 24-hour loss greater than 8%. Traders had also jumped in to get their part of this steep move in the last day of trading, as BTC’s trading volume also spiked 94.45% - taking the total to $32,493,575,137.
Notably, BTC had dropped below $26K over the past 24 hours to reach a low of $25,409.11. The full magnitude of the selloff that recently took place can be seen in the gap between BTC’s daily low and its 24-hour high at $28,655.50.

Daily chart for BTC/USDT (Source: TradingView)
The past 48 hours saw BTC’s price plummet by more than 7%, resulting in it breaking below the 9-day and 20-day EMA lines as well. Furthermore, the cryptocurrency also broke below the crucial support levels at $28,295.38 and $26,915, and continued to trade below these 2 significant price points at press time.
The medium-term bearish rising wedge pattern seems to have been validated. Subsequently, a continued price drop may take place in the next 24-48 hours. If this bearish thesis is validated, then the market leader’s price may fall to $24,200 in the next couple of days.
However, a daily close above $26,915 within the next 48 hours will invalidate the bearish thesis. In this scenario, BTC may look to enter into a recovery period to back within the aforementioned bearish medium-term pattern. This will see the cryptocurrency’s price climb back above the $28,295.38 mark. A confirmation of this recovery will be when BTC breaks above the 200-day EMA line at $27,280.91.
BTC and ETH Traders Account for 90% of Liquidations
ETH also experienced a significant price drop, leading to substantial losses for BTC and ETH futures traders. The past two days have witnessed these two major cryptocurrencies dipping below support levels, causing havoc in the market and shattering a period of relative stability.
BTC’s staggering decline marked one of the most significant two-day price drops since mid-June of this year, catching many traders off guard. However, the repercussions didn't stop at Bitcoin's doorstep; other prominent cryptocurrencies, including ETH and Solana (SOL), tumbled by as much as 5%, mirroring the downward trend set by the market leader.
The fallout from these price drops extended to the futures market, where traders using leverage found themselves grappling with substantial losses. In a mere 24 hours, liquidations on futures contracts tied to major tokens surpassed the $160 million mark. The week's losses soared to an astonishing $320 million, an alarming indicator of the intensity of the market's downturn. All of this transpired during a period of unusually low volatility for Bitcoin, adding to the surprise and impact of the price decline.
Looking at specific cryptocurrencies, Bitcoin futures bore the brunt of the losses, racking up nearly $50 million in liquidation-related damages. ETH followed suit with losses of around $22 million, while Litecoin (LTC) suffered a loss of $5 million. Traders who had positions in Bitcoin Cash (BCH), Solana, and XRP incurred losses of nearly $4.5 million each. The data paints a bleak picture of traders' fortunes during these tumultuous times.
A noteworthy observation from these liquidations is the dominance of long trades, which represent bets on higher prices. According to Coinglass data, long trades accounted for a staggering 90% of the total liquidations. This phenomenon suggests that the prevailing sentiment among traders was optimistic, anticipating price increases. However, the sudden and sharp price decline caught many off guard, leading to the forced closure of leveraged positions due to margin losses.
Liquidations, in essence, occur when traders are unable to fulfill the margin requirements for their leveraged positions or lack the necessary funds to sustain their trades. This situation prompts exchanges to step in and close these positions, safeguarding both the trader and the exchange from further potential losses. Large-scale liquidations like the ones witnessed recently can serve as indicators of local price tops or bottoms, potentially aiding savvy traders in positioning themselves accordingly.
Another intriguing development has been the rise in open interest, which refers to the number of unsettled contracts. Despite the volatile market conditions, open interest increased by 1.16%. This indicates that while more positions were opened, traders were cautious and utilized significantly lower leverage, suggesting a more restrained risk-on sentiment. This shift in behavior could be a response to the sudden and unexpected price drops, prompting traders to approach the market with greater caution.
