
Ethereum (ETH) experienced a slight drop in price over the past 24 hours. However, the leading altcoin was still able to outperform two of its biggest competitors, also known as Ethereum-killers, Cardano (ADA) and Solana (SOL) during this period. Furthermore, technical indicators on ETH’s daily chart suggested that a bullish trend reversal may take place in the coming few days, which may lead to ETH rising to $1,980 in the following few weeks.
Meanwhile, the price of the largest Ethereum-killer by market cap, ADA, was at risk of continuing its downfall in the coming week as it struggles to break out of a medium-term negative cycle. The same cannot be said for SOL, however, as it recently entered into a short-term bullish trend. Subsequently, SOL’s price could rise to $30 soon.
Read also: ETHW down over 80% from its Thursday ATH
What is an Ethereum-Killer?
An Ethereum-killer typically refers to a Layer 1 blockchain designed as an alternative to Ethereum. In order to be labeled as such, this blockchain must specifically tackle the well-known issues of Ethereum with the ultimate aim of replacing it within the cryptocurrency market.
The Ethereum development team is currently striving to address Ethereum's limitations through a series of updates. Nevertheless, the progress of these updates has been gradual, allowing Ethereum-killers the opportunity to leverage the delayed timeline and vie for a prominent standing in the cryptocurrency market. The majority of Ethereum-killers promise enhanced transaction processing speed and significantly reduced fees.
Read also: ETH's price underperforms despite bullish development
Nonetheless, Ethereum-killers boast distinctive attributes and functionalities. Despite garnering considerable attention initially, none have thus far succeeded in their endeavors to overthrow the Ethereum ecosystem.
Cardano (ADA)
At press time, CoinMarketCap indicated that ADA had experienced a slight 0.34% price drop over the past 24 hours. Consequently, the altcoin was trading hands at $0.2901. Furthermore, the negative daily performance also dragged ADA’s weekly performance further into the red zone to -0.92%.
This meant that ADA’s market cap was estimated to be $10,160,186,173 at press time. Alongside the 24-hour decline in its price, the altcoin did, however, experience a 26.47% uptick in its daily trading volume - taking the total to $147,262,877 as a result.
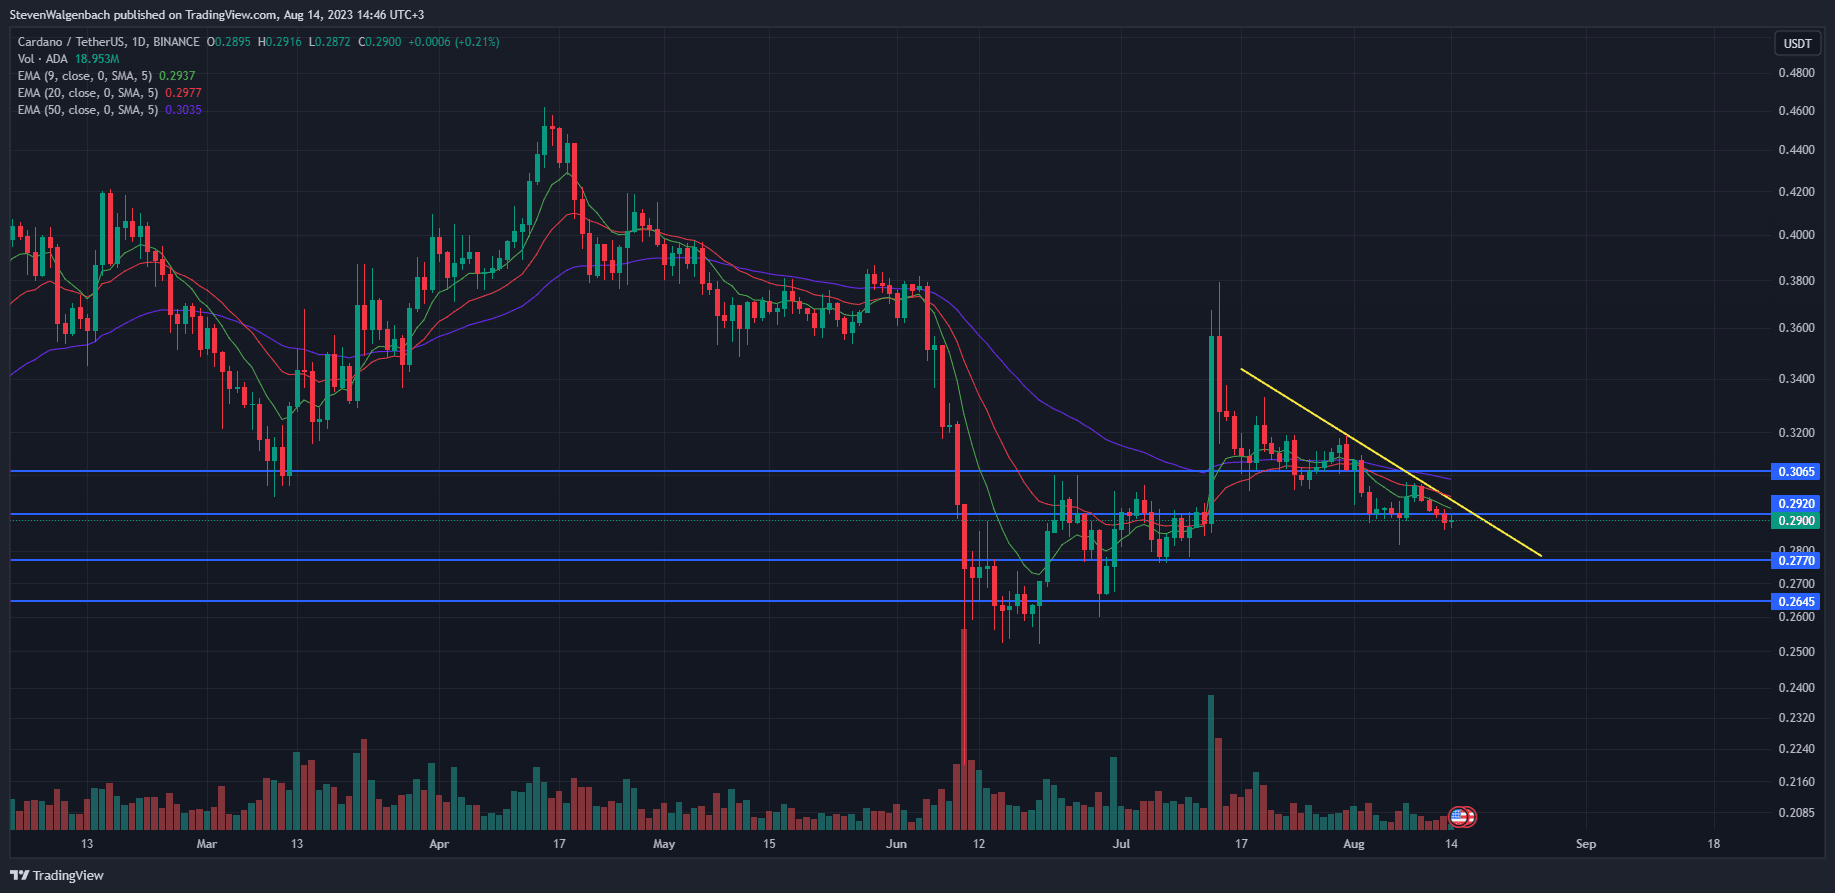
Daily chart for ADA/USDT (Source: TradingView)
From a technical perspective, ADA’s price had lost the support of the $0.2920 mark over the past 48 hours and continued to trade below this significant price point at press time. As a result, the cryptocurrency may be at risk of testing the next major support level at $0.2770 in the next couple of days. This short-term bearish outlook is supported by the current orientation of the 9, 20 and 50 Exponential Moving Average (EMA) lines on ADA’s daily chart.
At press time, the 9-day EMA line was positioned bearishly below the 20-day EMA line - indicating that short-term momentum was in favor of sellers at press time. In addition to this, both of these technical indicators were positioned below the medium-term 50-day EMA line. This meant that medium-term momentum was also in favor of sellers and ADA’s price may continue to gradually drop in the coming week.
If this bearish thesis is validated, then ADA’s price may drop to the aforementioned $0.2770 support level in the next couple of days. Continued sell pressure may even force the altcoin’s price to $0.2645 if it breaks below this crucial support level.
On the other hand, if ADA is able to close a daily candle above $0.2920, then buyers may boost the cryptocurrency’s price to above the next major resistance level at around $0.3065. Risk-averse traders may, however, want to wait for ADA’s price to close a daily candle above the negative trend line at $0.2960 before entering into a long position for the altcoin. Traders will also want to take note of the fact that ADA’s price will need to overcome the 9, 20 and 50 EMA lines on the daily chart before it can attempt to flip $0.3065 into support.
Solana (SOL)
Meanwhile, the next biggest Ethereum-killer in terms of market cap, SOL, also saw its price drop throughout the past day of trading. At press time, the altcoin’s price stood at $24.47 after it printed a loss of 0.89%. Despite the 24-hour decrease in its price, SOL’s weekly performance remained in the green zone at +6.20%. This also meant that SOL had a collective market cap of around $9,941,744,439.
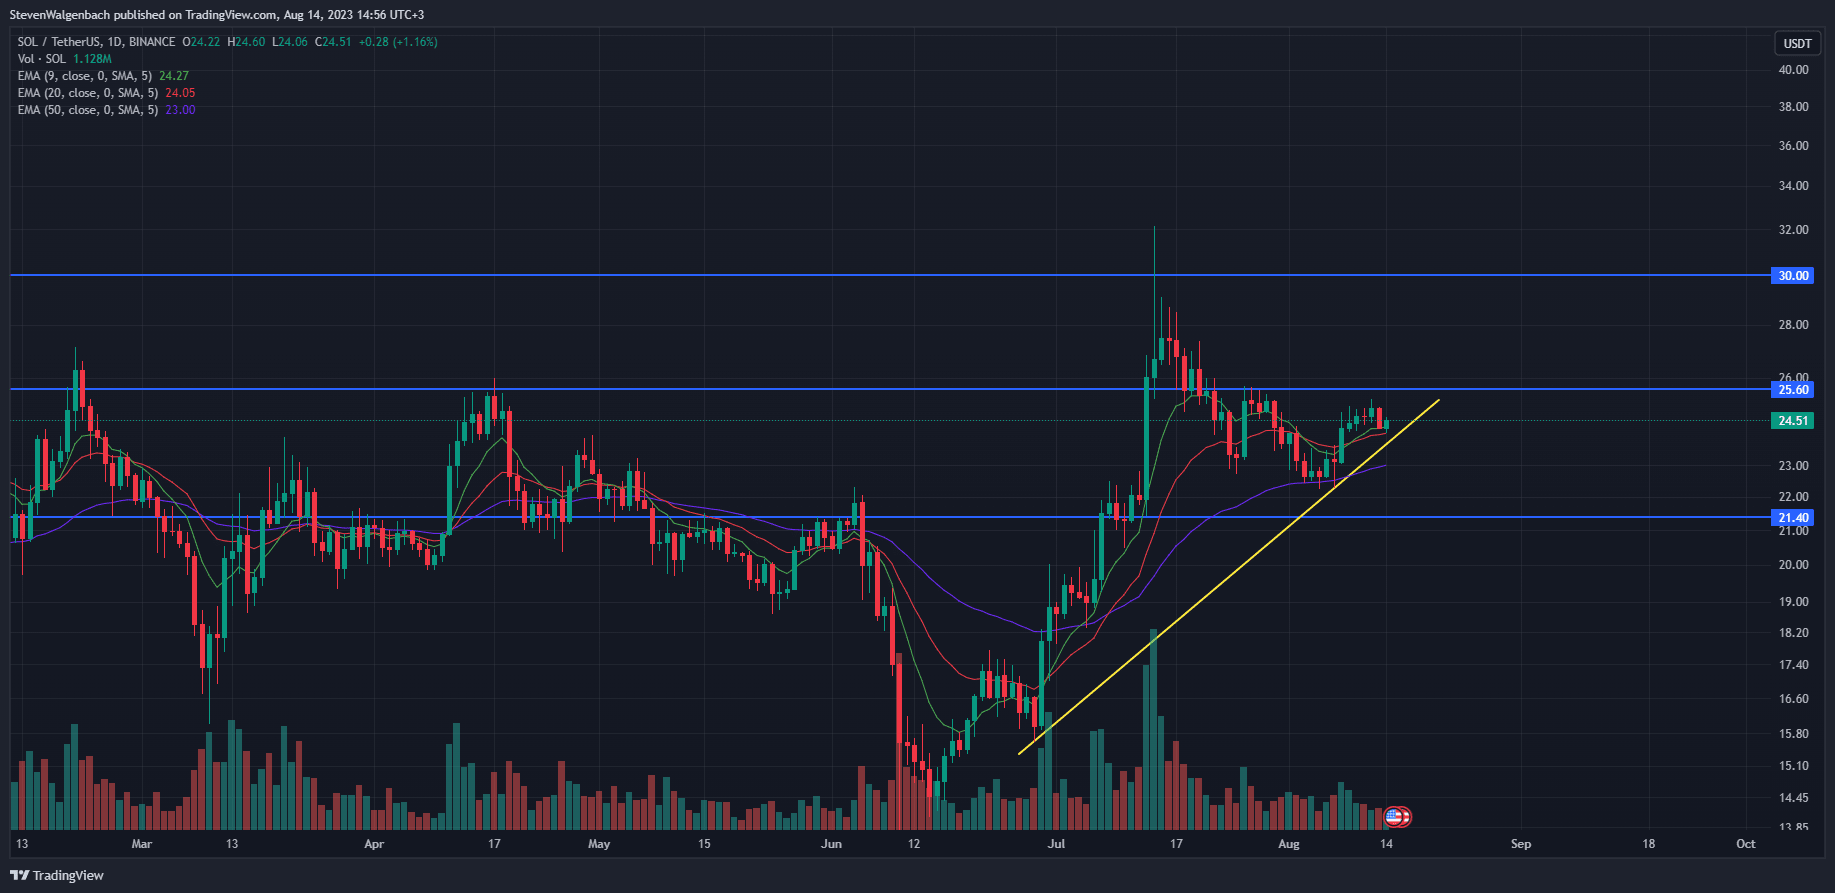
Daily chart for SOL/USDT (Source: TradingView)
Unlike ADA, SOL had recently entered into a short-term positive trend. This was evident by the fact that the 9-day EMA line was positioned above the 20-day EMA line. Although the altcoin’s price may rise in the next few days, investors and traders may want to wait for the cryptocurrency to close a daily candle above $25.60.
Should this happen, it will serve as a confirmation of the bullish thesis and SOL’s price will most likely rise in the following 72 hours. Furthermore, a daily close above this level will open up an opportunity for SOL’s price to potentially rise to $30 in the week thereafter.
However, a daily close below the 20-day EMA line at around $24.05 within the next 48 hours will put the altcoin at risk of testing the positive trend line that had formed on its daily chart. Should SOL’s price break below this trend line, then traders may look to open short positions, which will result in the cryptocurrency’s price dropping to the next key support level at $21.40.
Ethereum (ETH)
Similar to ADA and SOL, ETH also experienced a decrease in price in the last 24 hours. However, ETH was able to outperform its competitors by a slim margin during this period, as its price only dropped by 0.17%. Furthermore, ETH was up 0.80% for the week as well. Subsequently, the leading altcoin was changing hands at $1,845.62 at press time. ETH also had a more than comfortable lead over ADA and SOL in terms of market cap as its estimated market cap was $221,687,629,266.
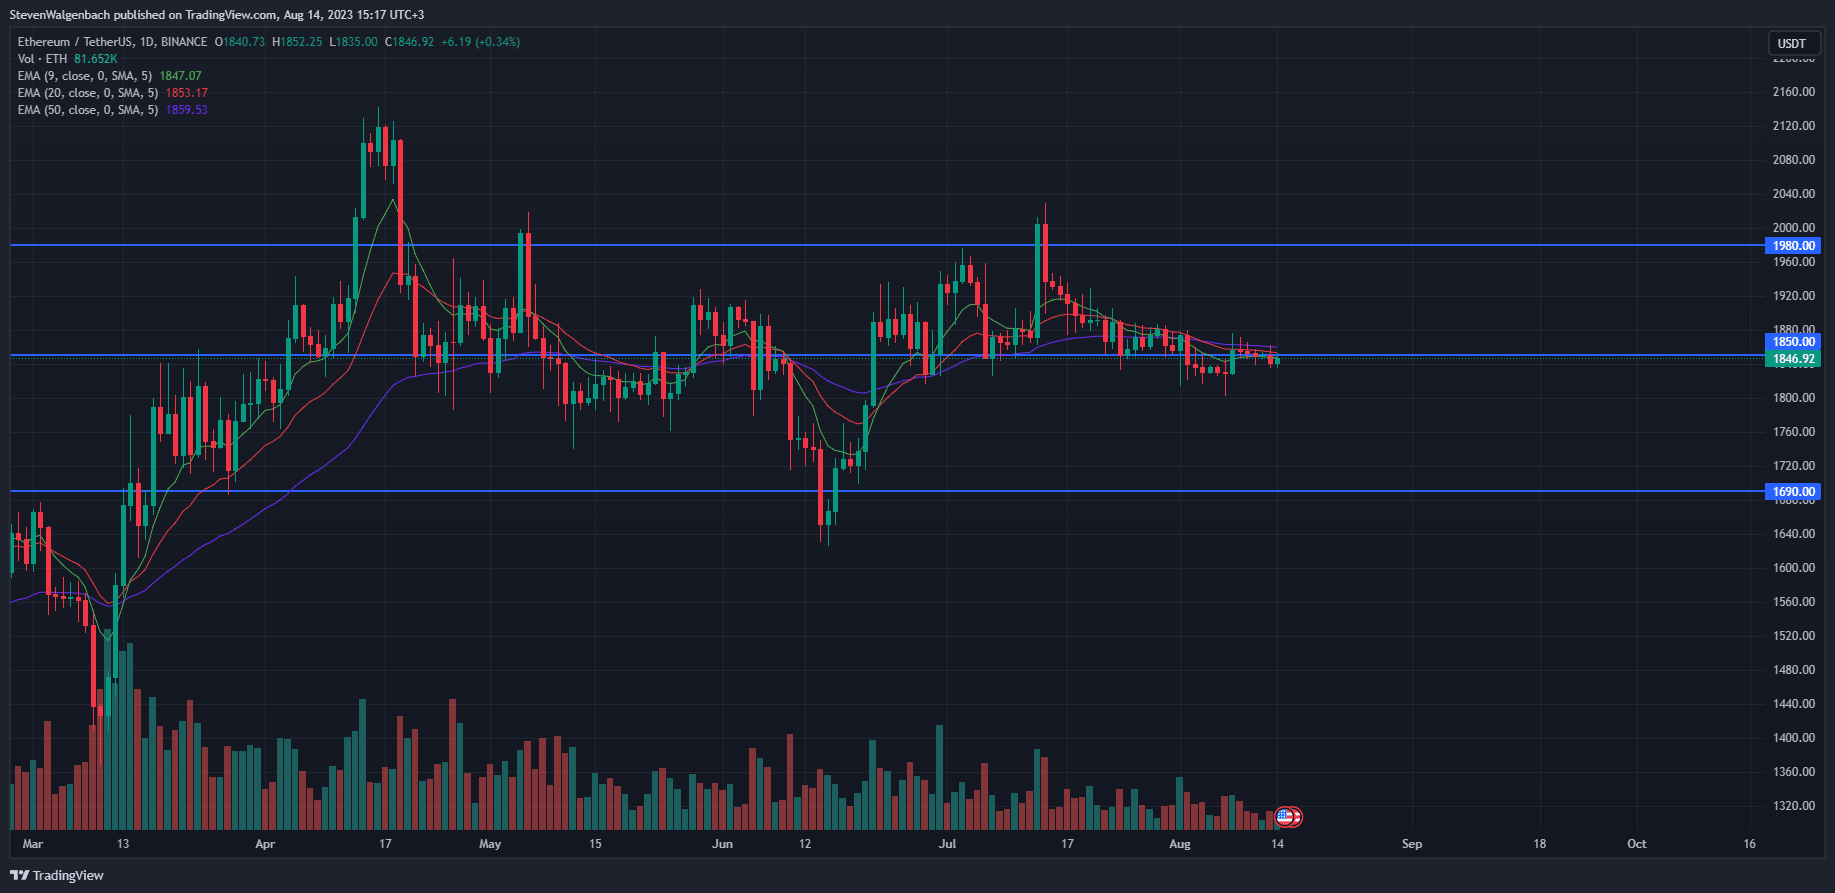
Daily chart for ETH/USDT (Source: TradingView)
From a technical standpoint, ETH’s price was at a decisive point which could either lead to it dropping to as low as $1,690 or test the resistance level at $1,980 in the upcoming couple of weeks. At press time, ETH’s price was lingering around the $1,850 resistance. Notably, the altcoin had been trading close to this significant price point for the past week - suggesting that a breakout may be in the cards for the altcoin king.
In the event that ETH closes a daily candle above the $1,850 resistance, and is able to maintain a position above this price point, then it may look to challenge the next major resistance level at $1,980 within the next 2 weeks. Confirmation of this bullish thesis will be when ETH’s price closes a daily candle above the 50-day EMA line at $1,889.51.
On the other hand, if ETH’s price breaks below the minor support level at $1,800 then it may fall to the previously-mentioned $1,690 price point. Investors and traders will want to keep in mind that the orientation of the 9, 20 and 50 EMA lines on ETH’s daily chart suggested that short-term and medium-term momentum was in favor of sellers, meaning that a drop in ETH’s price over the coming few days was more likely going to happen.
However, the gap that existed between the 9-day and 20-day EMA lines was narrowing at press time. Should these two technical indicators cross soon, then it may be an early indication of a bullish trend reversal for ETH. In this scenario, the altcoin’s price may overcome the 50-day EMA line and begin its ascent towards $1,980.
Disclaimer: Coinpaper does not recommend that any cryptocurrency should be bought, sold, or held by you. Always conduct your own research and consult your financial advisor before investing in any digital asset.
