
Bitcoin is sitting at a key point as traders watch the Federal Reserve and rising leverage in the market. Together, these signals suggest the current calm may not last much longer.
Bitcoin Holds Near $74K as FOMC Decision Looms
Bitcoin traded near $74,000 on Wednesday as markets positioned ahead of a U.S. Federal Reserve interest rate decision expected later in the day.
The price action showed consolidation after a recent decline, with Bitcoin stabilizing around key support levels near $72,000–$74,000. Chart data indicated that the asset had broken below a prior resistance zone near $80,600 and continued to trade under pressure in the short term.
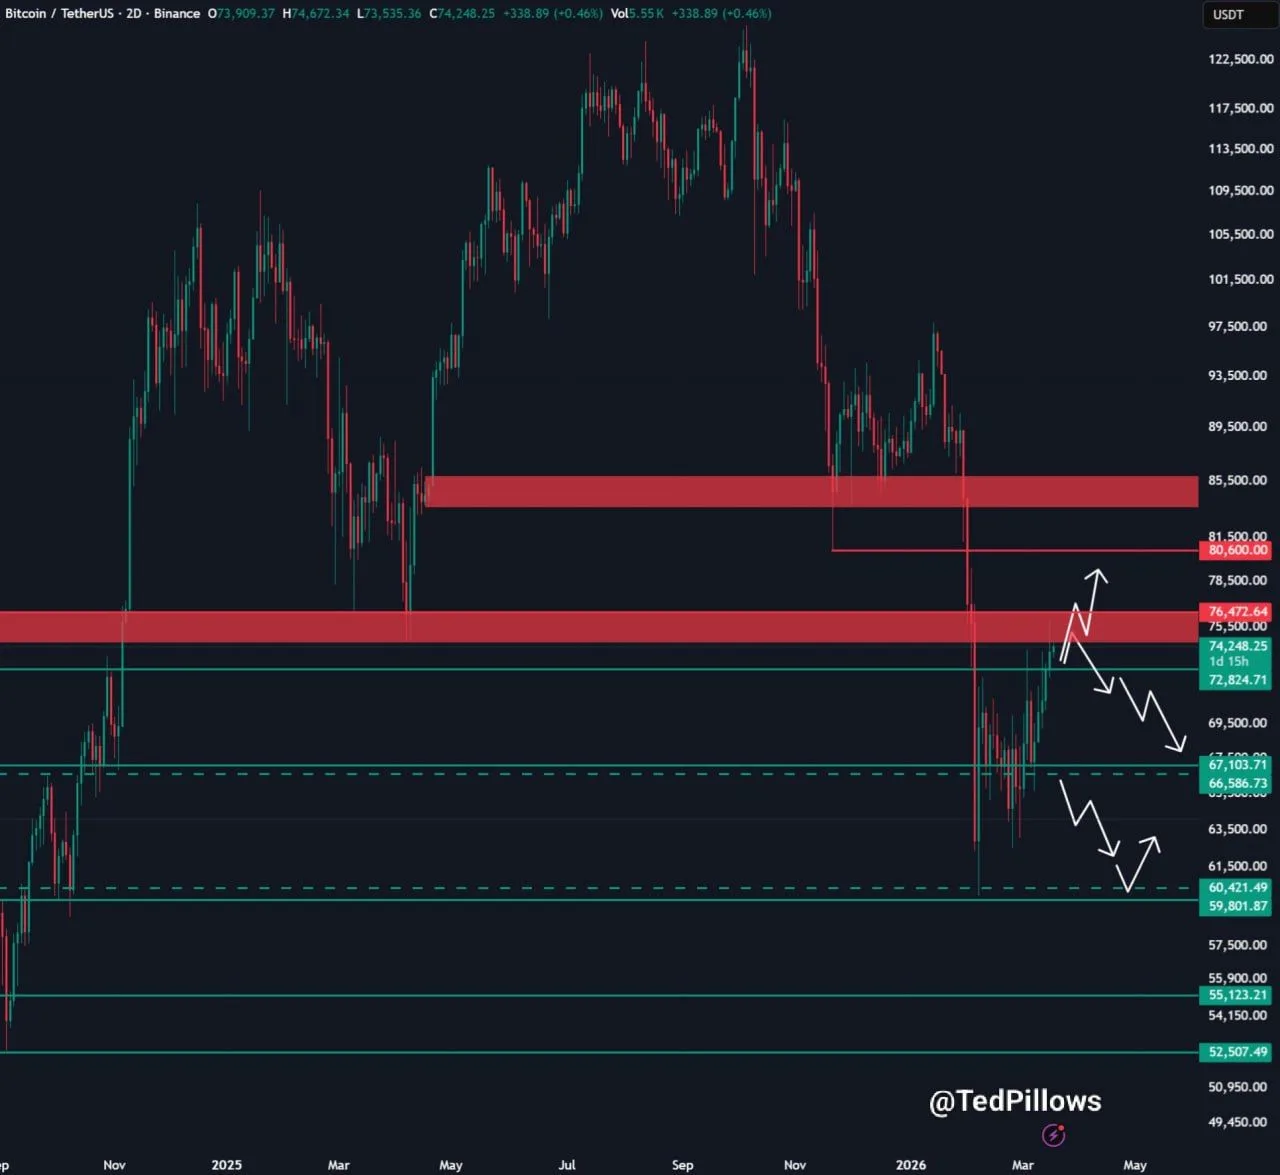
Bitcoin Price Chart. Source: Ted Pillows
At the same time, traders focused on the Federal Open Market Committee (FOMC) meeting, which often drives volatility across risk assets. Market participants typically adjust positions ahead of rate announcements, leading to sharp moves both before and after the decision.
Analyst Ted Pillows noted that Bitcoin could see a short-term price increase ahead of the event. He said the move could act as a local top before further downside or continued volatility. His outlook aligns with recent price behavior, where temporary rallies occurred before renewed selling pressure.
Meanwhile, technical levels remain in focus. Immediate resistance stands near $76,400, while support levels appear around $67,000 and $60,400. These zones could shape price direction depending on macro signals following the Fed’s announcement.
As a result, traders expect heightened volatility during the session, with Bitcoin likely to react quickly to interest rate signals and broader market sentiment.
Bitcoin Trades Sideways as Leverage Builds in Derivatives Market
Bitcoin moved within a tight range in recent sessions, while data showed a rise in high-leverage positions across derivatives markets.
Price action remained relatively flat, with Bitcoin holding near recent levels after a short-term recovery. At the same time, liquidation heatmap data indicated growing clusters of leveraged positions both above and below the current price range. These clusters often signal areas where forced liquidations may occur if price moves sharply.

Bitcoin Liquidation Heatmap. Source: CoinAnk
Market data shared by analyst CW highlighted that leverage continues to increase despite the lack of a clear trend. This setup can raise the likelihood of sudden price swings, as overleveraged positions tend to unwind quickly when key levels break.
Meanwhile, the heatmap showed dense liquidity zones forming near resistance and support areas. These zones can act as targets during volatile moves, as exchanges trigger liquidations once price reaches heavily leveraged levels.
As a result, the current structure points to potential volatility expansion. If Bitcoin breaks out of its range, it may trigger a cascade of liquidations, leading to rapid price movement in either direction.
