
Bitcoin trades at $67,671.57 as of writing, up 1.27% over the past 24 hours. Despite the daily gain, BTC remains down 5.36% over the past 7 days while also holding a 26.52% drop over the last 30 days. Price action now centers on key liquidity zones that could determine the next major move.
Technical Structure Tightens
BTC continues to test short-term resistance after repeated failures above the $70,000 level. Lower highs have formed in recent sessions, signaling reduced bullish momentum. At the same time, traders have identified a major liquidity cluster between $68,000 and $70,000, with another concentration near $65,000. Which level breaks first?

Source: Coinglass via X
Charts also show a developing liquidity void between $66,000 and $60,500. That imbalance increases the probability of a sharp move if price enters the zone. Analysts point to last week’s low near $59,800 as a potential downside target should sellers regain control.
In the near term, Bitcoin has defended support around $67,000 since yesterday. Buyers continue to step in at this level, preventing a deeper slide. Meanwhile, a triangle formation has emerged on lower timeframes, often signaling an impending breakout. A decisive move above resistance or below support could define the next short-term trend.

Source: Shango - X's Crypto via X
Open Interest And ETF Flows Shift
Derivatives data adds another layer to the current setup. Bitcoin exchange open interest has declined sharply from a recent peak of $66 billion on January 15 to $45.7 billion today, according to Coinglass. Falling open interest often reflects reduced leveraged positioning, which can limit volatility but also signal waning speculative momentum.
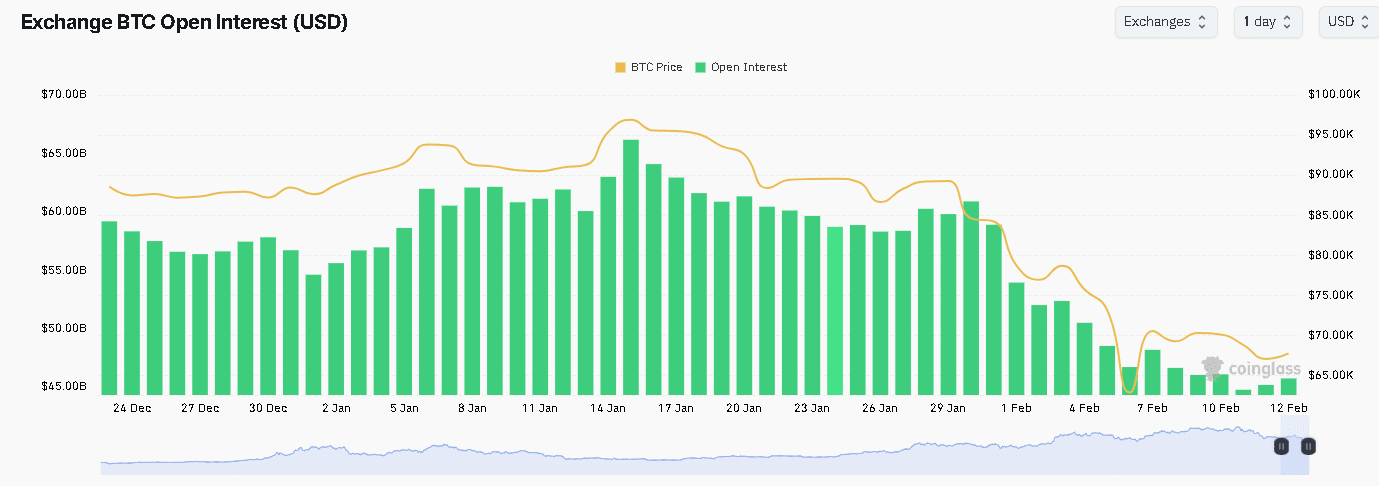
Source: Coinglass
At the same time, Bitcoin ETFs recorded outflows of 4,020 BTC, valued at approximately $276.3 million, yesterday. The outflows followed a stretch of consistent inflows that began on February 6. ETF flows frequently influence short-term sentiment, as sustained inflows can support price while outflows may create temporary selling pressure.
Macro Data Adds Fresh Uncertainty
Macroeconomic data also shapes the broader environment. The US economy added 130,000 jobs in January, exceeding expectations of 70,000. The unemployment rate fell to 4.3% from 4.4%, according to the Bureau of Labor Statistics. Stronger labor conditions reduce the likelihood that the Federal Reserve will cut interest rates in the near term.

Source: Forex Factory
Higher-for-longer rate expectations typically support the US dollar. A firmer dollar can pressure risk assets such as Bitcoin by tightening financial conditions. Gold often reacts differently, as traders sometimes view it as a hedge during inflationary or uncertain periods. If inflation data surprises to the downside, the dollar could weaken, potentially supporting both Bitcoin and gold.
Markets now turn attention to US Consumer Price Index data due Friday. Economists expect headline and core CPI to rise 2.5% year-over-year, with monthly increases of 0.3%. A softer reading could weigh on the dollar and lift risk assets. A hotter print could reinforce expectations for steady rates.
Liquidity Sweep Ahead?
Bitcoin now stands at a fix between macro forces and technical structure. The $68,000–$70,000 zone holds dense liquidity above, while $65,000 sits below as another magnet. Price compression within the triangle pattern suggests that a breakout is approaching.
How quickly can buyers reclaim momentum before another liquidity sweep unfolds? The answer may arrive with the next catalyst, whether from economic data or derivatives positioning.
