
Bitcoin's latest slide has traders comparing today’s structure to past cycle turns, with two chart posts drawing the most attention. One flags a possible 8-month range between $45,000 and $60,000, while another says the 50% drawdown reflects sellers overpowering buyers, not a single headline.
Trader flags 2021-style bear pattern, calls for 8-month Bitcoin range
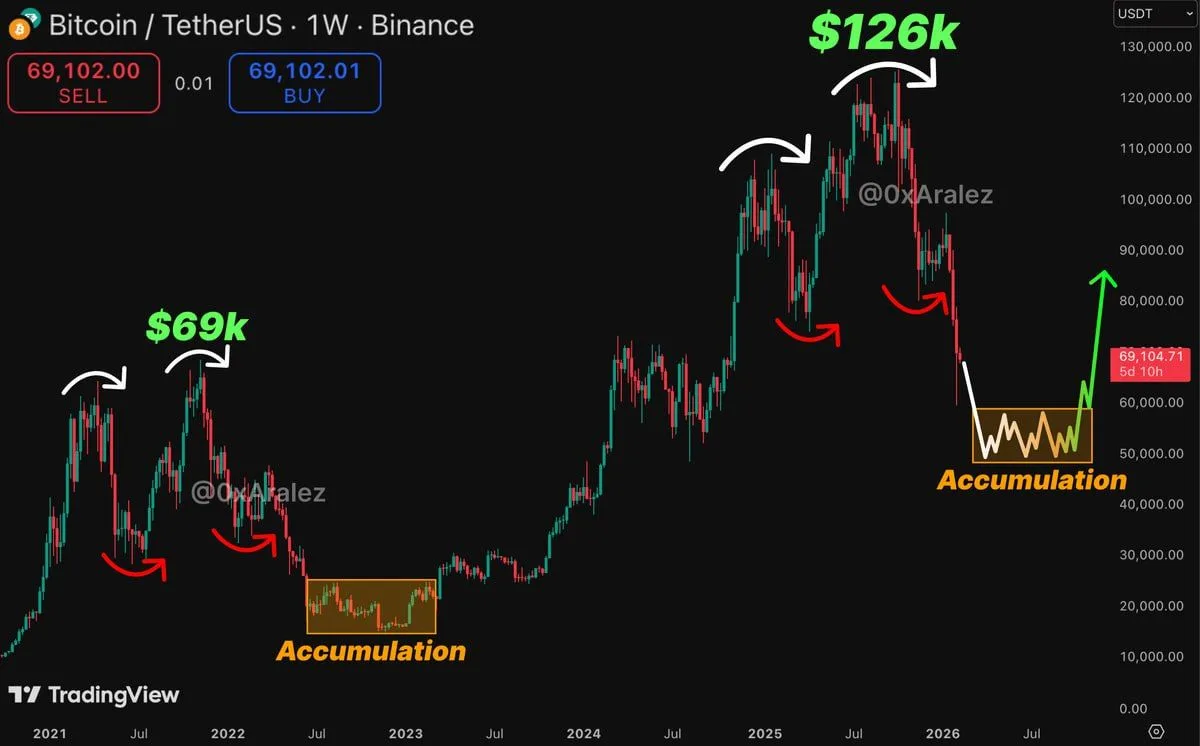
An X user posting as Aralez shared a weekly Bitcoin to Tether chart from Binance and said the setup “predicted a massive market drop,” while arguing price action now repeats the 2021 bear cycle. In the post, Aralez pointed to Bitcoin trading near $69,100 and said the next phase could be an eight-month accumulation band between $45,000 and $60,000.
Bitcoin 2021 Bear Cycle Repeat Chart. Source: Aralez on X
The annotated chart highlights two cycle peaks and the selloffs that followed. It marks Bitcoin’s 2021 top near $69,000, then shows a steep decline into 2022, followed by a boxed “accumulation” zone that sits around the low-$20,000 area. On the right side, it labels a later peak near $126,000 and then draws curved arrows over successive swing highs and pullbacks, framing the drop as a repeat of the earlier cycle’s topping sequence.
After the latest decline, the chart projects a second boxed “accumulation” area around $45,000 to $60,000, with a jagged line suggesting sideways trading before a potential move higher. The visual also includes a green upward arrow near the $80,000 level, which implies an eventual rebound after the range. Still, the post presents a scenario rather than a confirmed outcome, since the projection depends on whether price stabilizes inside that band instead of extending the selloff below it.
Daan Crypto Trades says Bitcoin drop passes 50% mark as chart maps selloffs to shifting narratives
Daan Crypto Trades said on X that Bitcoin has fallen more than 50% from its all time high, and therefore the current downturn feels tougher to buy because he sees no single headline driving it. He framed the move as a simple supply and demand imbalance, saying sellers outweigh buyers, while adding that sentiment has deteriorated because traders struggle to find a clear positive catalyst.

Bitcoin Selloffs and Market Narratives Chart. Source: Daan Crypto Trades on X
In a TradingView chart dated Feb. 10, DaanCryptoTrades annotated multiple pullbacks across the broader uptrend and linked earlier drawdowns to specific episodes. The labels include “Bank Failures USDC FUD,” “2023 Post Bear Market Recovery Chop,” “Post ETF Sell Off,” “Post ETF Mania Sell Off,” and “Gox Distributions,” each paired with a day count that suggests how long the slump lasted.
Later, the chart marks “Yen Carry Trade Blow Up,” “Post Inauguration & Tariffs,” and “Middle Eastern Conflict,” then highlights a longer stretch labeled “Cycle Ending Fears Strong Whale Selling Massive Liquidation Event (46 days).”
The right side of the chart points to another decline tagged “Overall Market Volatility Extreme Crypto Weakness (23 days),” with a steep drop into early 2026. A price label on the chart shows Bitcoin around $68,610, and the post argues that this phase lacks a dominant narrative that could soften the selloff in traders’ minds.
DaanCryptoTrades said that, without a clear outlook, many participants wait for momentum to return, and he described his approach as moving slowly and accumulating over time while staying prepared for different outcomes.
