
Lamborghini has entered the crypto hardware market with a branded Bitcoin wallet released through a partnership with Ledger. At the same time, a key momentum signal seen at Bitcoin’s past major bottoms has returned on the weekly chart.
Lamborghini Unveils Branded Bitcoin Wallet Through Ledger Partnership
Lamborghini has introduced a branded Bitcoin wallet through a new partnership with Ledger, expanding the automaker’s push into digital collectibles and crypto-focused merchandise. The company revealed a limited-edition Ledger Stax device that carries Lamborghini styling, custom packaging and a branded Magnet Folio.
The device functions as a full Ledger Stax hardware wallet, which means it supports Bitcoin along with thousands of other digital assets. Ledger said the product keeps the standard security architecture and touchscreen interface while adding Lamborghini’s design elements for collectors and crypto users.
The edition is set to ship in early 2026. Lamborghini did not develop its own wallet software or custody platform, but the collaboration marks its latest move into Web3 after earlier NFT and digital ownership releases.
Bitcoin Hits Key Signal Last Seen Before Major Rallies
Meanwhile, A chart shared by analyst Merlijn The Trader shows Bitcoin repeating the same technical pattern that marked its last three major cycle lows. The weekly data highlights how previous bottoms formed when the Relative Strength Index reached its lowest band and the DSS Bressert indicator turned upward at the same time.
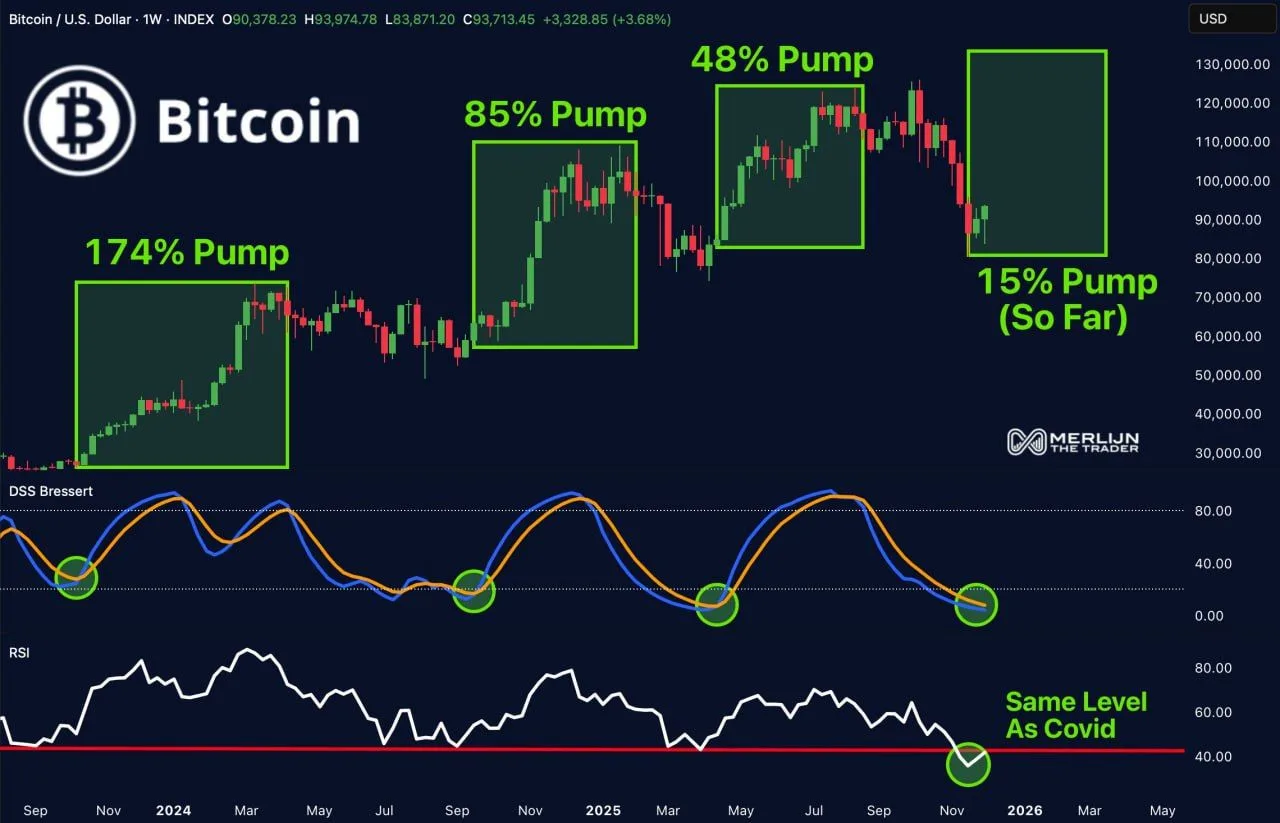
Bitcoin Weekly Pump Cycles. Source: Merlijn The Trader
In the earlier cycles, this alignment preceded sharp recoveries. Bitcoin rallied about 174 percent after the first signal, then 85 percent, and later 48 percent as the same structure appeared on the weekly chart. Each move began after momentum flipped from oversold conditions into a sustained uptrend.
The latest reading shows the RSI dropping to levels last seen during the March 2020 crash. At the same time, the DSS indicator has turned higher, repeating the earlier configuration. Merlijn noted that the combination has been easy to overlook in real time, yet it consistently marked the moment when downward pressure faded and buyers stepped in.
