
Now a cluster of on-chain, derivatives and market-cap charts points to quiet strength beneath Chainlink’s latest pullback.
Chainlink Whales Turn Net Buyers as Bullish Signal Appears
Chainlink’s largest holders have flipped back to accumulation after a period of steady selling. On-chain data show wallets holding between 10,000 and 10 million LINK added about 150,000 tokens, worth roughly $2.36 million, in recent sessions. The move follows several weeks of distribution while the token remained under pressure.

Chainlink Whale Accumulation Chart. Source: Santiment/X
At the same time, LINK’s chart has printed a bullish relative strength index divergence, where momentum turns higher while price lags. This pattern often precedes short-term trend reversals, and it now appears as LINK trades about 33 percent lower over the past three months. The combination of renewed whale inflows and improving momentum puts fresh attention on whether the token can build a stronger base after the recent drawdown.
LINK Whales Accumulate as Price Slips Below $16
Meanwhile, Chainlink’s drop under the $16 level has not stopped larger holders from adding to their positions. On-chain data tracked by analyst @WispOfDeFi show whale wallets pulling supply off the market while exchange reserves continue to decline, signaling fewer tokens available for immediate sale.
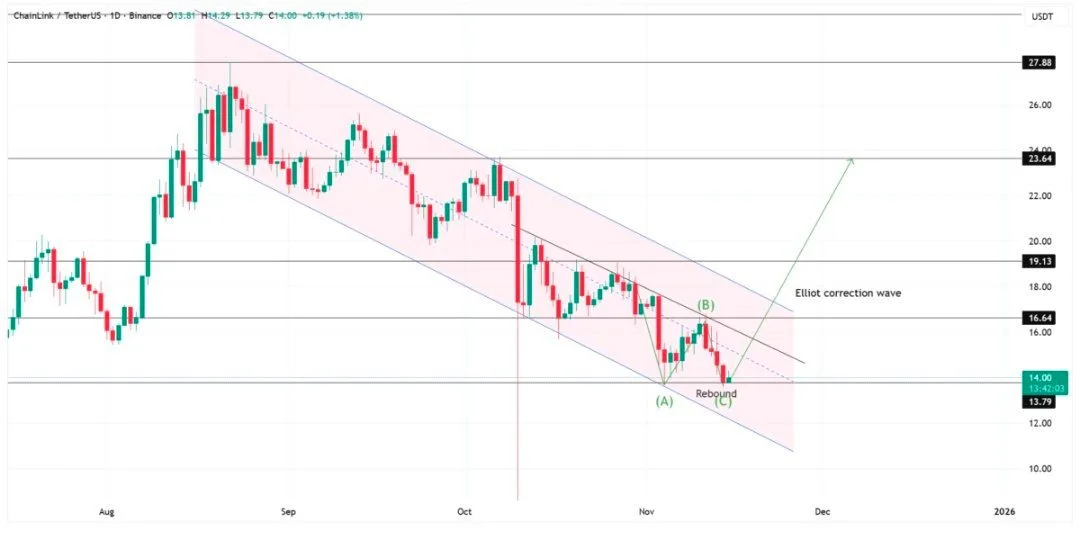
Chainlink Elliott Wave Rebound. Source: WispOfDeFi
At the same time, derivatives metrics point to more aggressive positioning on the bullish side. Taker buy volume is rising, and top traders hold a majority of their contracts in long positions, suggesting they expect the recent downtrend to fade rather than deepen.
In this setup, $16.64 stands out as the key price to watch on the chart. The analyst notes that a close back above that level would mark a reclaim of broken support and could open the door to a move toward the $19 area, arguing that such a rebound “might come faster than people expect.”
Chainlink Market Cap Returns to Long-Term Trendline Support
Then Chainlink’s market-cap chart has once again slipped into its rising trendline, a level it has tested multiple times over the past two years. Analyst Investing DeCrypted notes that the structure mirrors earlier retests that preceded strong upside swings, placing fresh attention on whether LINK can hold this higher-timeframe support.
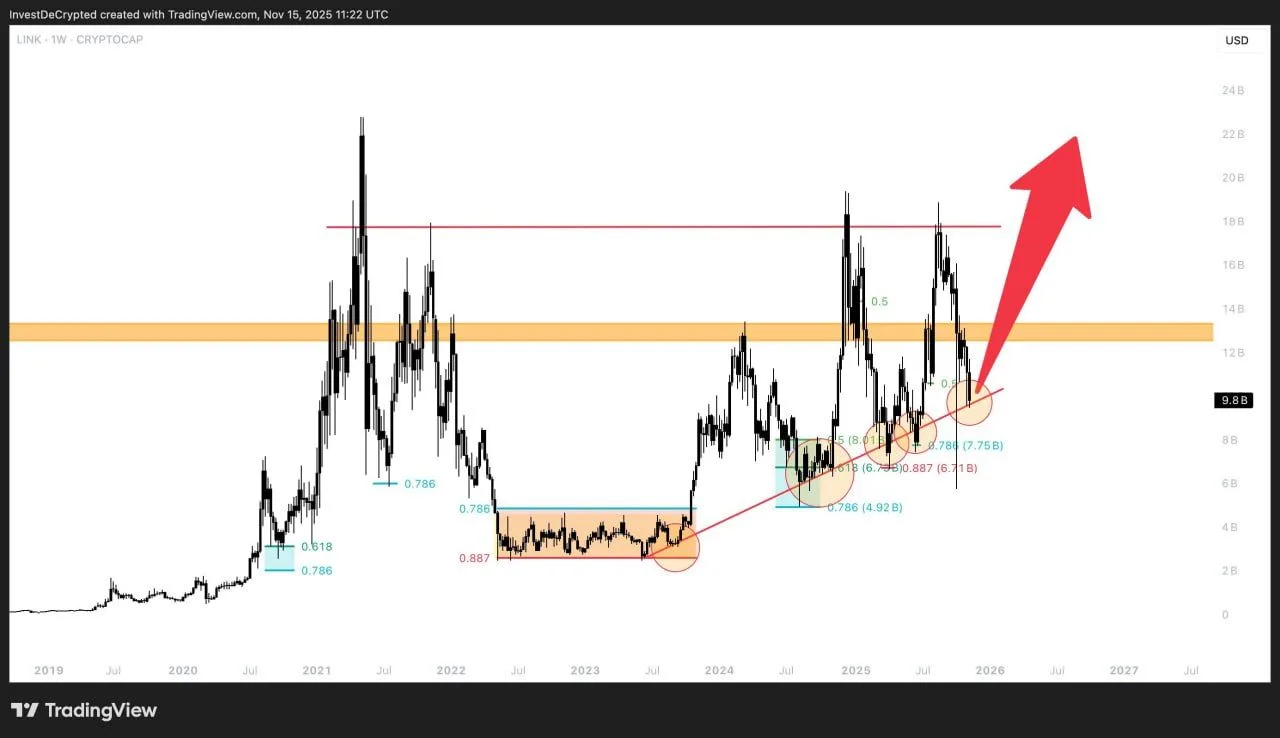
Chainlink Long-Term Market Cap Trendline. Source: Investing DeCrypted
In addition, the chart shows a sequence of higher lows forming since late 2022, reinforcing the long-term uptrend despite periods of deep volatility. Each major pullback has tapped the same ascending base before reversing, and the current move now sits in that zone once again.
Furthermore, the analyst argues that this positioning creates a challenging environment for sellers from a risk-reward standpoint. With the market cap still compressing above the rising trendline, he says the setup favors patience rather than capitulation and maintains that Chainlink remains one of the most significant projects in the crypto sector.
