
Chainlink is deepening its role in real-world asset markets just as LINK’s charts hit key long-term levels. ApeX Exchange’s new RWA perpetuals and fresh technical setups now frame the next phase for the token across spot and derivatives markets.
ApeX integrates Chainlink Data Streams to launch RWA perpetual markets
ApeX Exchange has adopted Chainlink Data Streams to power new on-chain real-world asset perpetuals, expanding its derivatives offering across multiple networks. The perp DEX, which reports more than $200 billion in trading volume, confirmed that the upgrade is now live for users on Arbitrum, Base, BNB Chain, Ethereum and Mantle.
ApeX Chainlink Integration. Source: Chainlink on X
According to the announcement, Chainlink’s low-latency price feeds allow ApeX to support tokenized treasury and commodity-linked perpetuals with faster updates and stronger execution guarantees. The exchange said the integration also standardizes pricing across chains, which helps keep liquidation and funding calculations consistent as volumes move between networks.
ApeX noted that the rollout marks its shift toward “omnichain” RWA markets, giving traders access to synthetic exposures backed by the same data used by institutional platforms. Chainlink added that Data Streams are designed to handle high-frequency pricing for assets that require tighter spreads and more reliable latency, which previously limited RWA perps on decentralized venues.
Chainlink tests resistance after bounce from double support
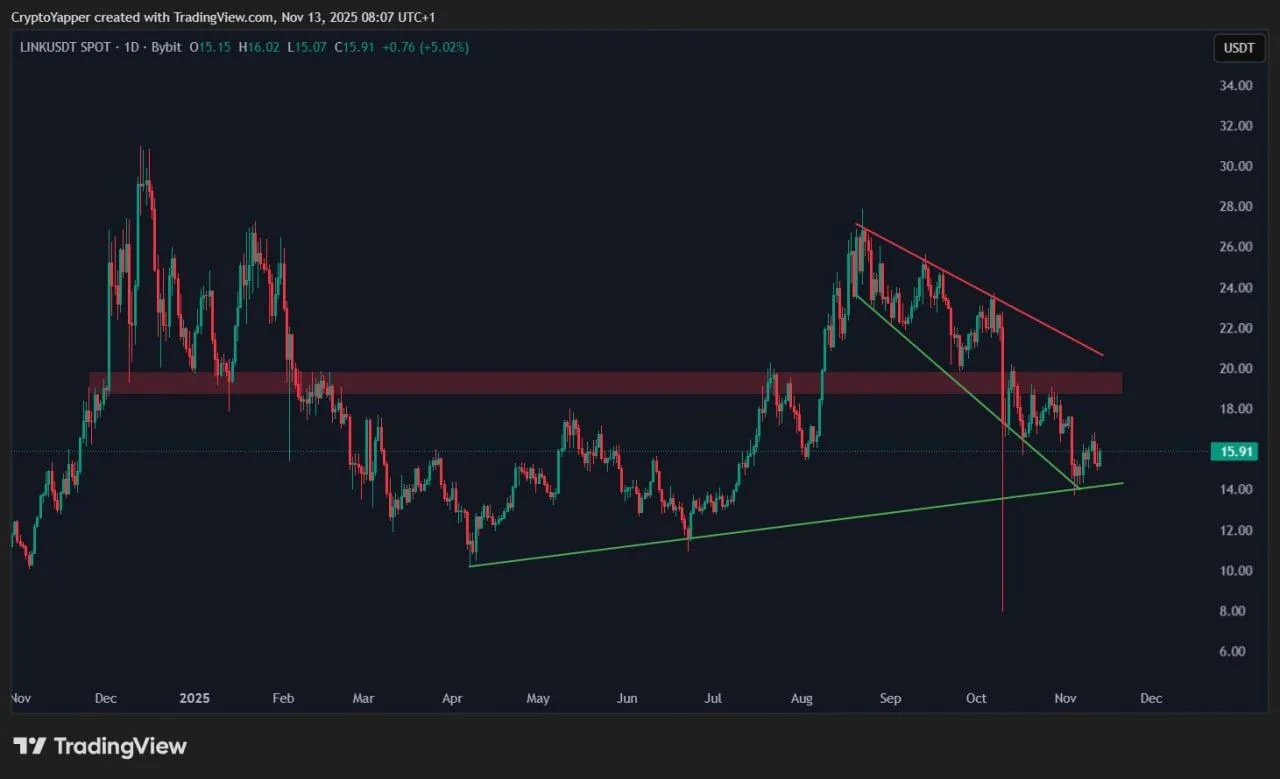
Meanwhile, Chainlink is trying to extend a rebound from a double daily support zone as traders watch a key resistance near $19. Analyst Crypto Yapper shared a daily LINK/USDT chart on X showing the token bouncing off an ascending support line after a sharp October drop and revisiting mid-$15 levels.
Chainlink Daily Chart. Source: CryptoYapper
The chart highlights a horizontal resistance band around $19 that capped recent rallies and overlaps with a prior supply zone. If LINK breaks and holds above that area, it would clear the descending trendline from September highs and open room for a deeper recovery. However, as long as price trades below $19, the ascending green support line remains the main level protecting the current structure.
Chainlink compresses in long-term triangle as analyst highlights $8–$12 zone
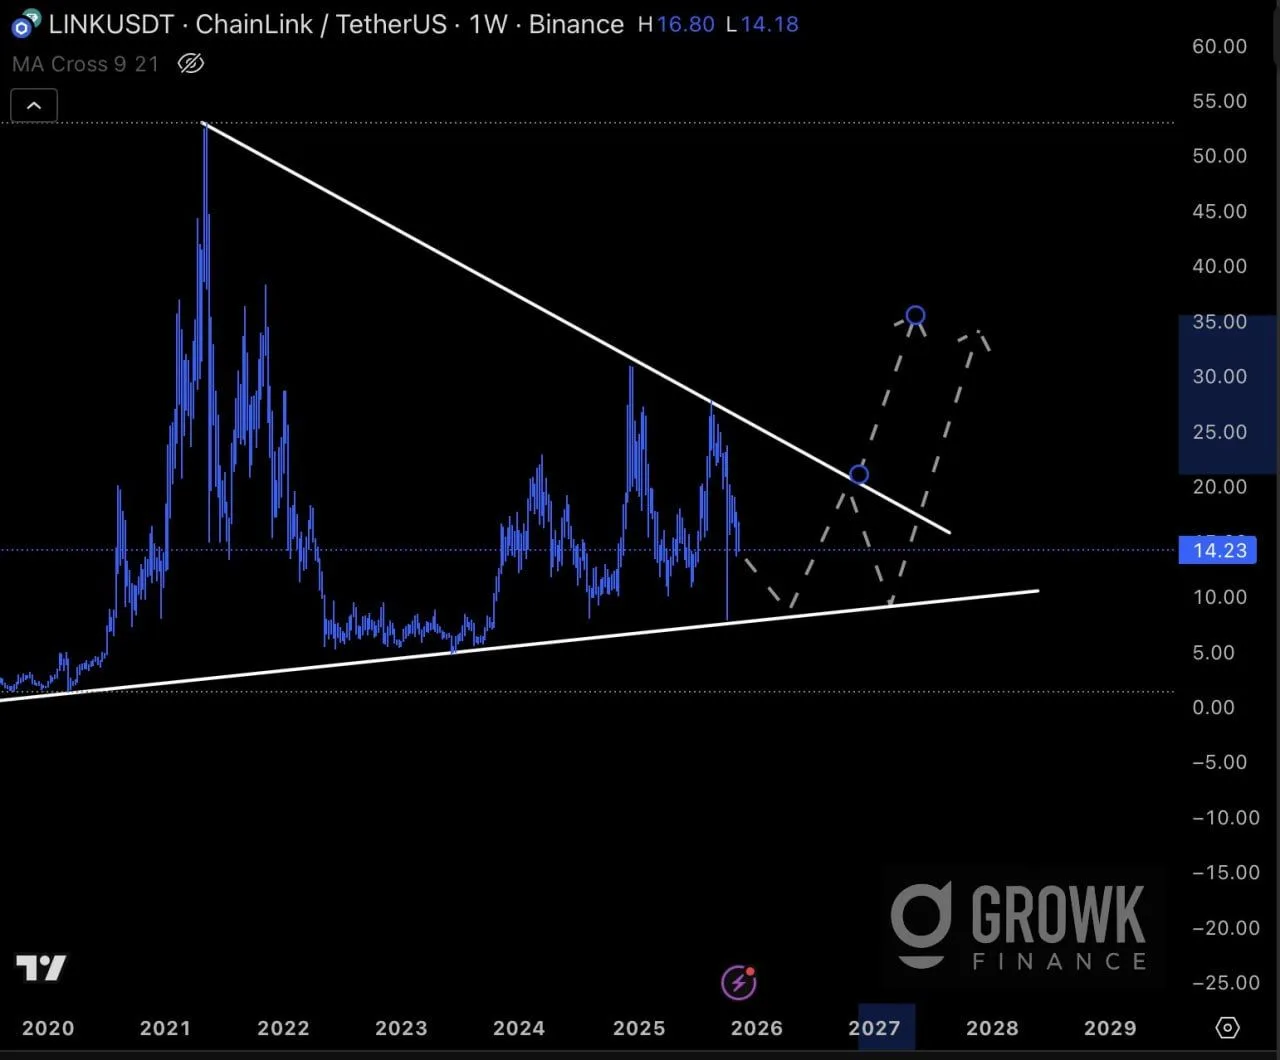
Chainlink continues to trade inside a multi-year symmetrical triangle on the weekly chart, with price compressing against converging trendlines that have been in place since 2021. Analyst Growk Finance notes that the structure leaves roughly two years before the pattern must resolve with a decisive move either higher or lower.
Chainlink Long Term Triangle. Source: Growk Finance
In the meantime, the chart shows LINK holding above a rising support line that has guided the market higher from previous cycle lows. The descending upper boundary, drawn from the 2021 peak through later lower highs, now caps the range and defines the breakout level for any future bullish move.
Growk Finance adds that the area between $8 and $12 remains the most attractive accumulation region if price revisits it. That zone aligns with the rising support trendline and previous reaction lows, making it a key level for traders tracking the long-term consolidation.
