
Bitwise’s proposed Chainlink ETF appeared on the DTCC eligibility list, marking progress toward a possible market debut. At the same time, Chainlink trades in a tight range while analysts track accumulation signs on LINK/BTC ahead of a potential breakout.
Bitwise Chainlink ETF gains DTCC listing, signaling progress but not SEC approval
Bitwise’s proposed Chainlink ETF appeared on the DTCC eligibility list under “Bitwise Chainlink ETF (beneficial interest),” indicating the clearinghouse has set up back-office readiness for potential trading. The listing follows industry practice in which the DTCC prepares tickers ahead of a possible market debut.

Bitwise Chainlink ETF on DTCC List. Source: X
However, the DTCC entry does not equal approval. The fund still requires an effective SEC registration statement and an exchange listing before shares can trade. Until those steps occur, the ETF remains pending.
The move nevertheless places Chainlink in line with recent crypto-themed products advancing through operational checkpoints. Market participants now watch for formal SEC actions and exchange notices that would confirm a launch timeline.
Chainlink holds between $13 and $26 as breakout signals take shape
Chainlink continues to trade between $13 and $26 on the weekly chart, a range analyst Ali describes as a no-trade zone. Price has made several attempts to leave this band in recent months, but each move faded before confirming direction. The structure reflects contracting volatility as highs and lows converge.
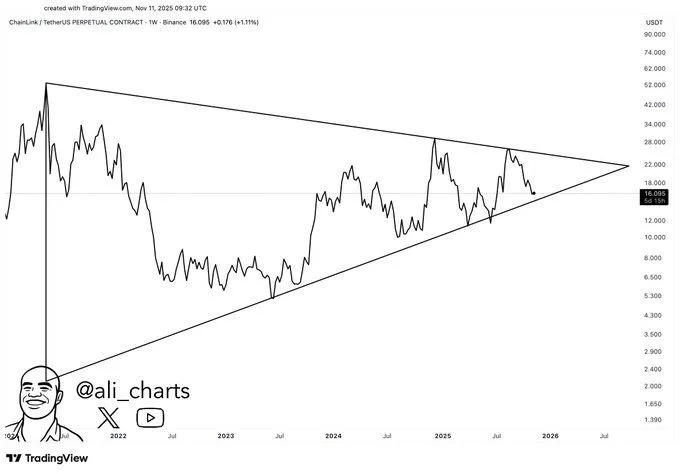
Chainlink USDT weekly chart, symmetrical triangle. Source: @ali_charts on X
Traders now focus on evidence that ends the stalemate. A weekly close above $26 would mark a range breakout to the upside, while a weekly close below $13 would confirm a downside break. In both cases, technicians look for rising volume and strong follow-through to validate the move rather than a single intraday spike.
Until a confirmed break occurs, risk-reward remains poor for trend trades inside the band. Mean-reversion setups can still appear within the range, but they carry headline risk if price accelerates through either boundary. Therefore, market participants watch $26 and $13 as the levels that likely set the next major swing.
Analyst flags accumulation zone on link/btc as breakout level looms
Meanwhile, Michaël van de Poppe said Chainlink is in a “great spot” for accumulation and “ready to make a new leg upward,” citing expectations for a stronger DeFi cycle in 2026. He shared a weekly LINK/BTC chart highlighting the structure.
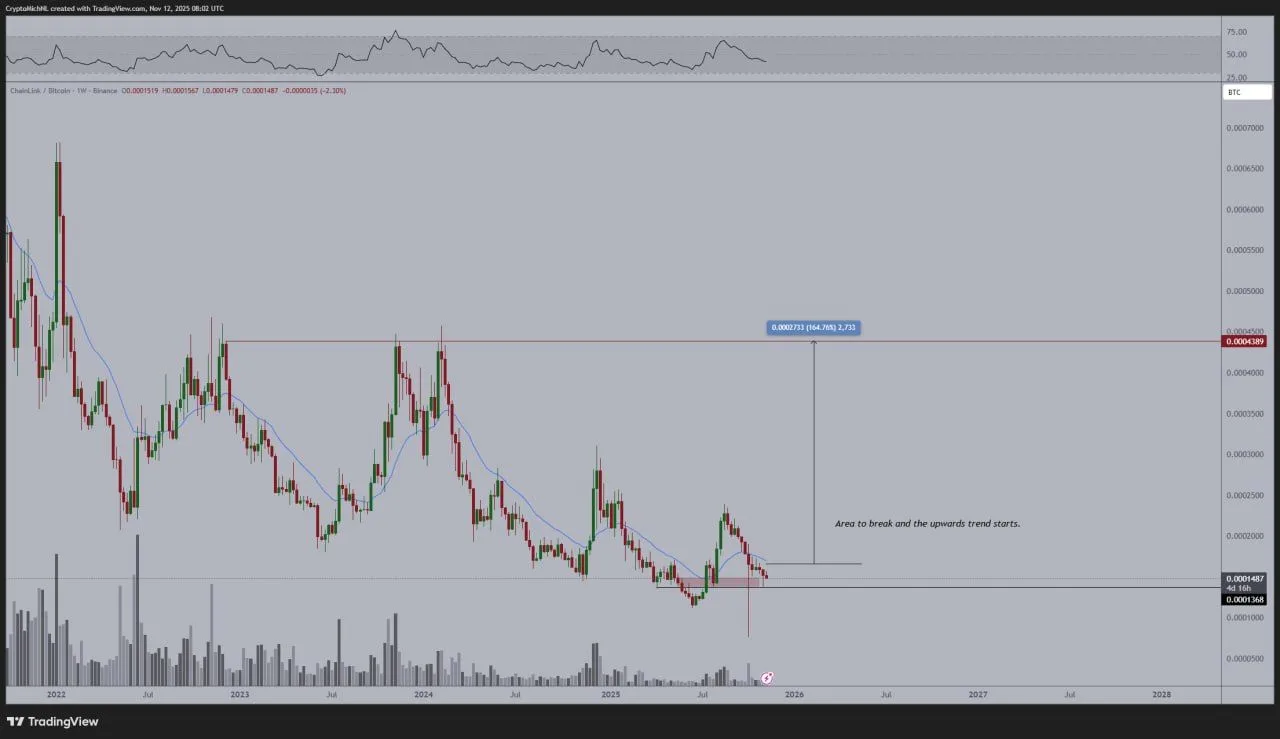
Chainlink/Bitcoin weekly chart, breakout setup. Source: @CryptoMichNL on XThe chart places immediate support near 0.0000137 BTC and shows price hovering around 0.0000148 BTC. It also marks a key resistance zone around 0.0000439 BTC with the note “area to break and the upwards trend starts.”
Until price clears that resistance on a weekly close, the pair remains range-bound. However, a decisive move above the 0.0000439 BTC line would signal trend reversal, while failure to hold support would keep consolidation intact.
