
In This Article
There are several XRP resistance levels that span daily, weekly, and monthly timeframes.
With technical pressure mounting and bullish headlines circling, the battle for control is intensifying. Traders are watching one tight corridor between $2.14 and $2.43—because a breakout here could launch XRP toward long-awaited highs.
Daily XRP Resistance Levels: $2.29 in the Spotlight
On the daily chart, XRP has entered a tight sideways pattern. Support consistently holds above $2.14, while resistance near $2.29 keeps rejecting upward moves. This narrow range has become a hotbed for short-term trading decisions.
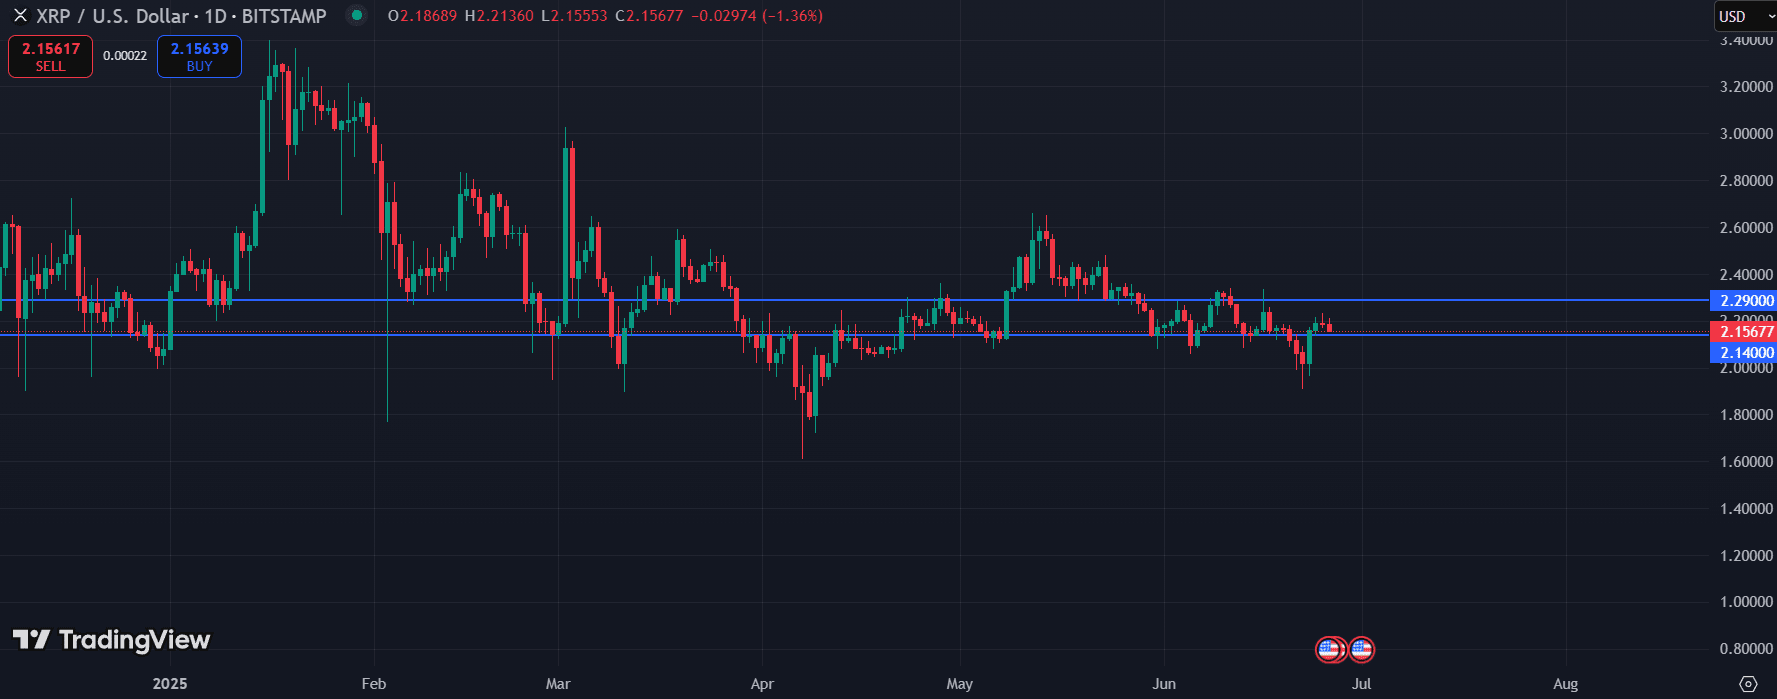
Daily chart for XRP/USD (Source: TradingView)
| Type | Price Levels | Significance |
| Support | 2.1453, 2.1398, 2.1394 | A strong demand zone; frequent rebounds show that buyers are defending this floor. |
| Resistance | 2.2949, 2.3211, 2.3238 | Caps upward momentum; a breakout could spark rapid bullish continuation. |
Caps upward momentum; a breakout could spark rapid bullish continuation.
A break above the $2.29 zone with high volume could signal renewed buying interest and may serve as the launchpad for testing higher timeframe resistance.
Weekly XRP Resistance Levels: Eyeing the $2.43 Break
Zooming out to the weekly chart reveals XRP testing a long-standing ceiling near $2.428. This level has consistently rejected price moves since late 2023, making it a critical marker for medium-term momentum.
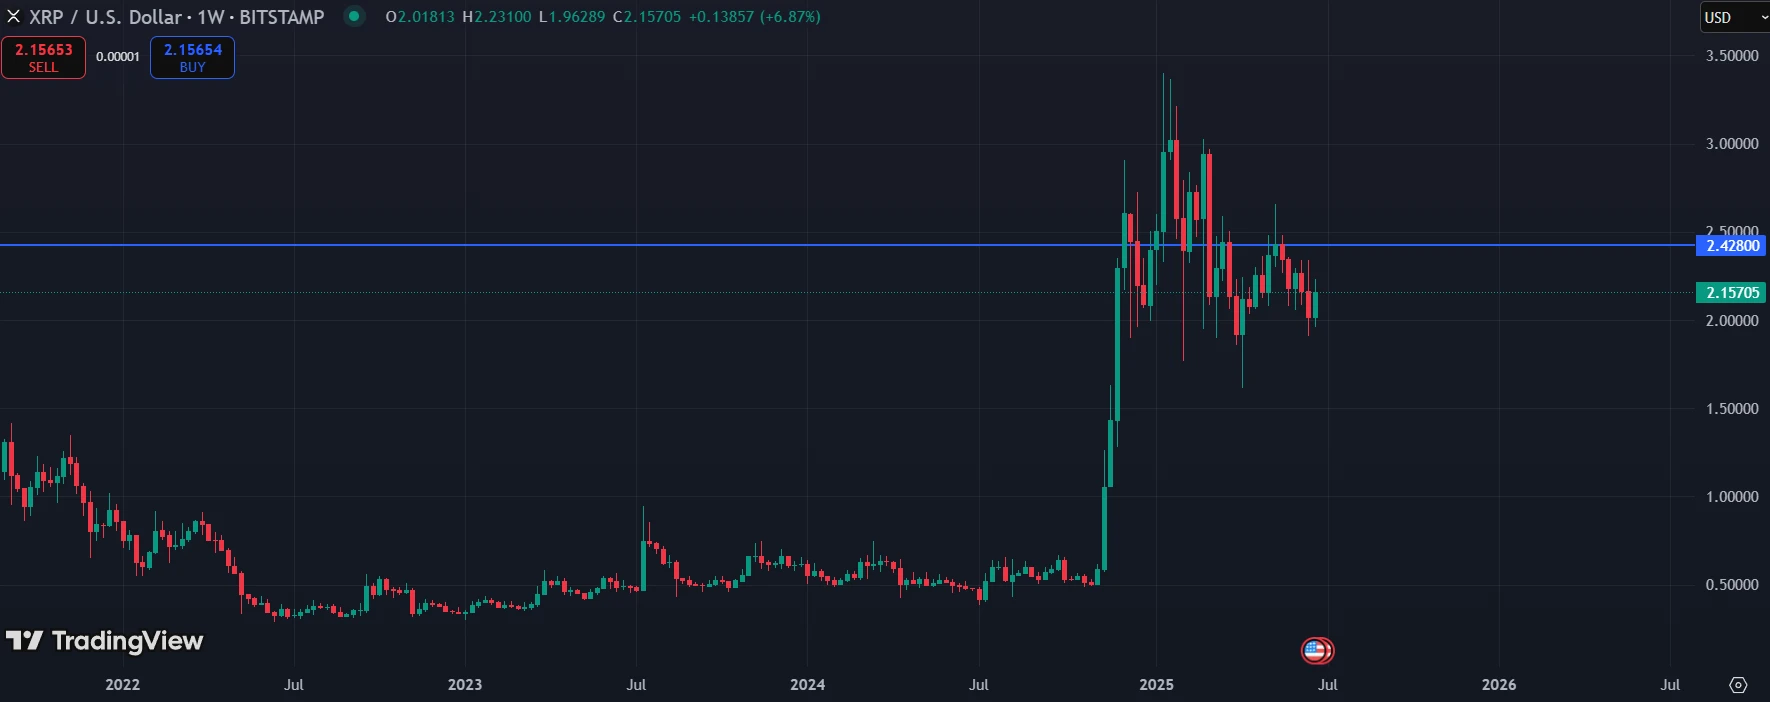
Weekly chart for XRP/USD (Source: TradingView)
| Type | Price Levels | Significance |
| Support | 1.9218, 0.9436, 0.6013 | $1.92 is the first key buffer; deeper levels mark historical accumulation zones. |
| Resistance | 2.428, 2.6013, 3.0223 | A weekly close above $2.60 sets up the next challenge—testing the macro ceiling. |
Monthly XRP Resistance Levels: The $3 Barrier Still Holds
The long-term chart adds another layer to the XRP story. XRP has failed to break above $3 decisively, despite multiple rallies. Yet higher lows continue to compress price action into a long-term squeeze.
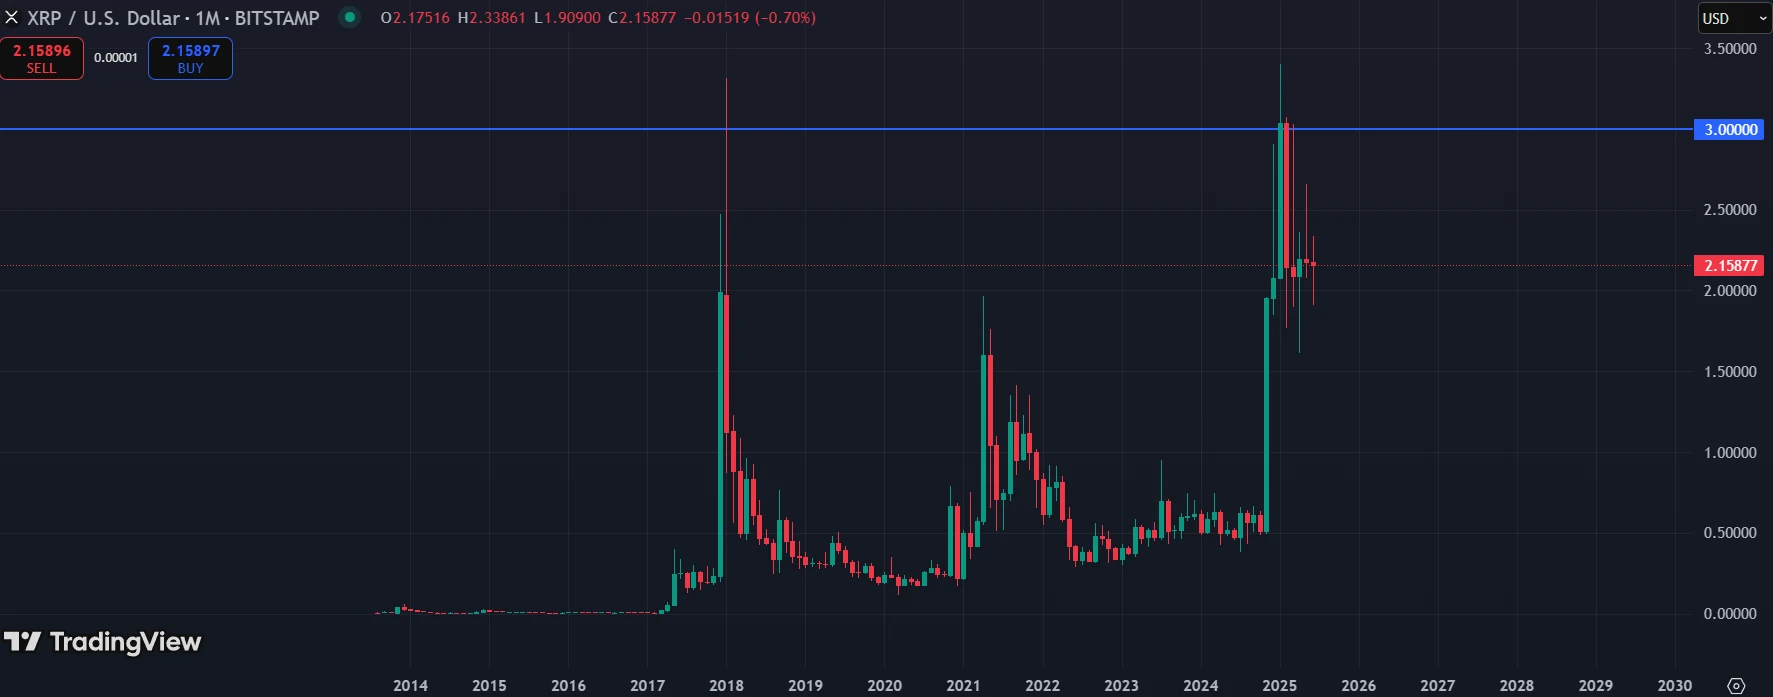
Daily chart for XRP/USD (Source: TradingView)
| Type | Price Levels | Significance |
| Support | 0.4761, 0.3277, 0.21959 | These levels reflect past cycle bottoms, especially during regulatory uncertainty. |
| Resistance | 3.0361 | The macro ceiling; a close above marks the start of a true price discovery phase. |
The Compression Zone: $2.14–$2.43 Is the Battlefield
What makes XRP especially compelling right now is how all timeframes are converging. The price range between $2.14 and $2.43 includes both daily support and weekly resistance. This creates a compression zone where sentiment is likely to flip dramatically once a breakout—or breakdown—occurs.
Potential Scenarios
| Outlook | Trigger | Target Levels |
| Bullish | Daily breakout > $2.29 + Weekly close > $2.428 | $2.60 → $3.03 (macro breakout) |
| Bearish | Loss of $2.14 on daily + Weekly close < $1.92 | $0.94 → $0.60 → $0.47 (retracement) |
XRP News That Could Push Through Resistance
Ripple’s Legal Momentum
Ripple’s partial win against the SEC, which ruled that XRP’s programmatic sales are not securities, continues to cast a bullish light. U.S. exchanges have responded by relisting XRP, and the ruling offers mid-term regulatory clarity.
ETF Speculation Gains Steam
Rumors of an XRP spot ETF have intensified, following Bitcoin and Ethereum ETF approvals. Some forecasts even suggest a $5 price target by 2025 if the ETF narrative materializes. This could be a catalyst strong enough to smash through technical ceilings.
Geopolitical Stability Boosts Crypto
A ceasefire in the Middle East recently sparked a risk-on rally across global markets. XRP gained 9% in one day, proving that macro headlines can fuel rapid price movements—especially when they align with technical breakout setups.
Institutional Interest and CBDC Talk
A U.S. congressional report floated the idea of including XRP in a future digital asset reserve to support central bank digital currencies (CBDCs). While speculative, this underscores the growing legitimacy XRP is gaining in policy circles.
Final Thoughts: Is XRP Ready to Break Out?
All eyes are on XRP’s $2.14–$2.43 range. If bulls can push above the $2.29 daily cap and then close the week over $2.428, a full-scale breakout toward $3 and beyond becomes increasingly likely. On the flip side, failure to hold $2.14 could expose XRP to a sharp retracement back to the $0.94–$0.60 zone.
Traders and investors should treat this as a pivotal moment. With both the technical setup and the news cycle aligned, XRP is at the edge of either its next major rally—or a short-term reset.
