
In a recent update, the cryptocurrency community received valuable insights from the esteemed cryptocurrency analyst and trader, Michael van de Poppe. His analysis pointed to a pivotal moment in the cryptocurrency market as it attempted to surmount a formidable resistance level. Van de Poppe expressed his optimism that this market breakthrough could occur in the coming weeks. Adding to the bullish sentiment, he suggested that the potential approval of Ethereum (ETH) exchange-traded funds (ETF) futures might serve as the catalyst igniting a broader cryptocurrency market rally. Meanwhile, Michael van de Poppe is not alone in his bullish outlook for October. Crypto Tony, another prominent analyst, has also suggested a positive trajectory for the cryptocurrency market.
Crypto Tony also spotlighted Chainlink (LINK) as an altcoin of interest due to its recent impressive performance. He noted that LINK's price was approaching a significant resistance level, potentially driven by the emergence of a bullish medium-term reversal pattern on LINK's charts.
These insights from Michael van de Poppe and Crypto Tony have ignited anticipation within the cryptocurrency community, as market participants eagerly await developments in the coming weeks, especially regarding the Ethereum ETF and Bitcoin's potential rally beyond its resistance levels.
The Market Attempts to Break a Key Resistance Level
In an X post on 21 September 2023, renowned cryptocurrency analyst and trader Michael van de Poppe revealed that the total capitalization for the cryptocurrency market was attempting to overcome a strong resistance level. More specifically, he noted that the market’s combined valuation was attempting to overcome the 200 week EMA line.
In his post, van de Poppe shared his belief that it may only be a matter of time until the market breaks above this significant technical indicator. According to the analyst, this may happen within the next few weeks. He also added to his bullish prediction by stating that the potential approval of ETH ETF futures could be the catalyst that will ignite a market wide rally.
Technical Overview
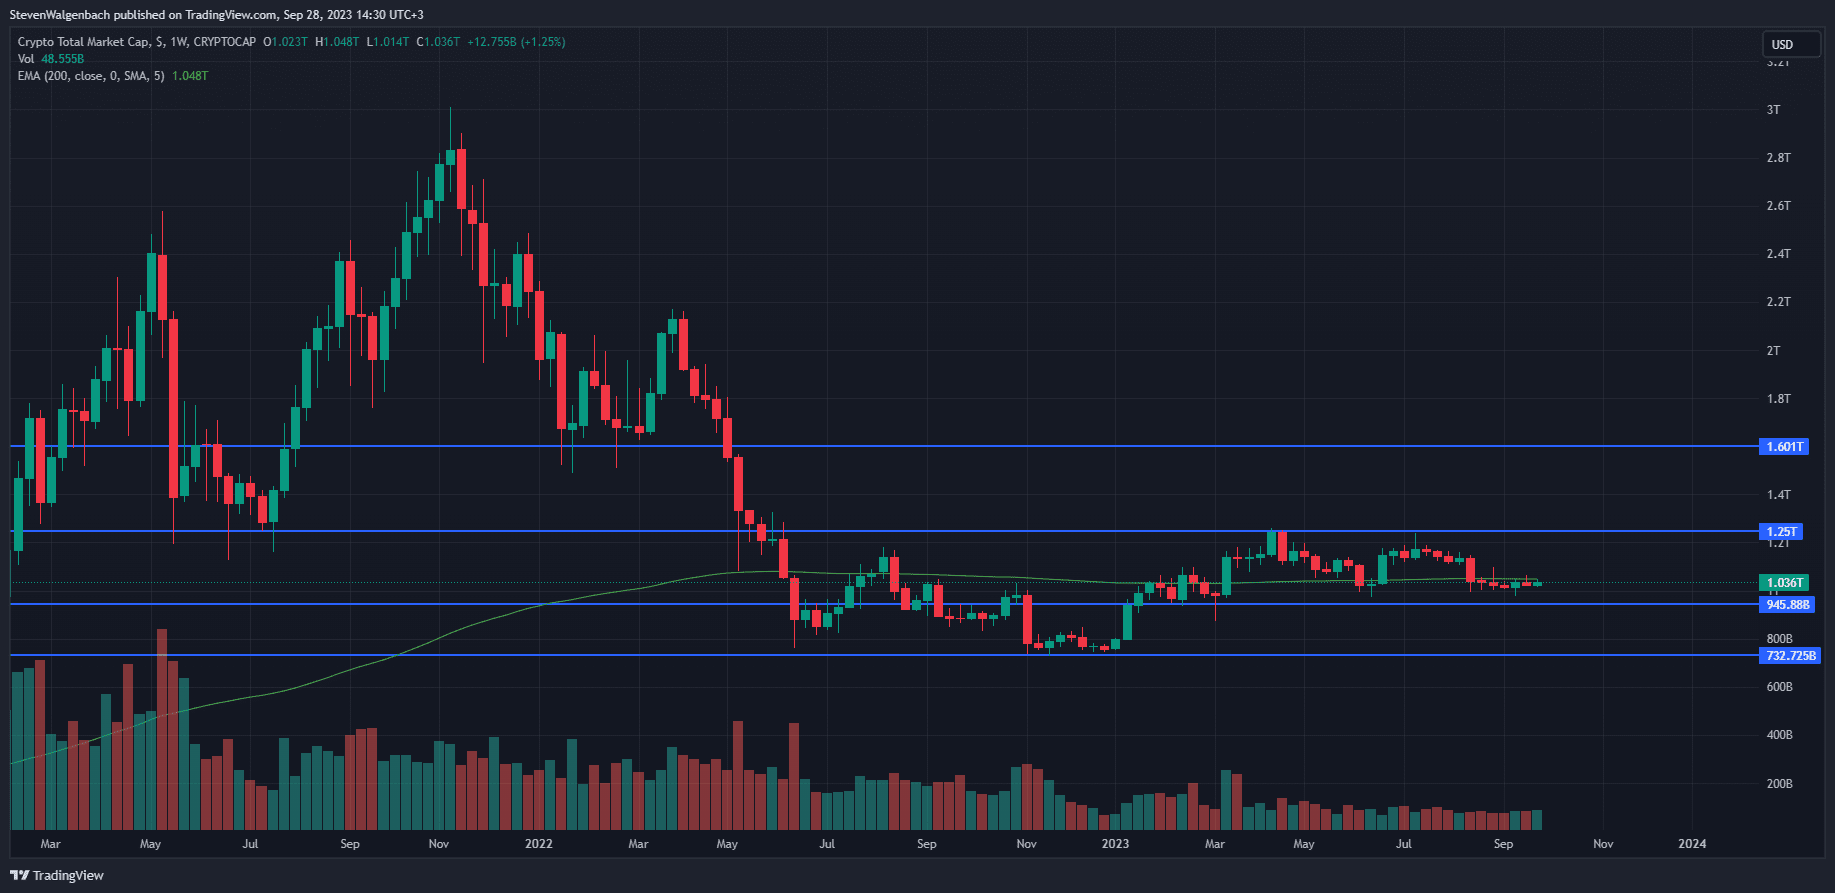
Weekly chart for TOTAL (Source: TradingView)
As can be seen on the weekly chart for the cryptocurrency market cap (TOTAL), the market’s valuation was trading just below the 200 week EMA line highlighted by van de Poppe. This was after the market’s capitalization had consolidated between $945.88 billion and $1.25 trillion over the past few months.
Subsequently, a weekly candle close above this EMA line may be followed by the market reaching a valuation of around $1.25 trillion. Thereafter, enough bullish momentum could boost the market above this threshold to the next barrier at $1.601 trillion in the following couple of weeks.
On the other hand, the market failing to close a weekly candle above the 200 week EMA line within the next month could result in its valuation dropping to the immediate support at $945.88 billion within the next month. Continued sell pressure may drag the total cryptocurrency market cap down to $732.725 billion as well.
Bitcoin (BTC) Rebounds From Key Support; Rally to Follow?
Van de Poppe is not the only analyst that foreshadows a bullish October. During the past 24 hours, the popular analyst Crypto Tony revealed that the market leader Bitcoin (BTC) had rebounded off of a key support zone. Subsequently, the analyst believes this is an early indication of the expected bullishness that will enter the cryptocurrency market in the next few weeks.
Meanwhile, data from the cryptocurrency price tracking website CoinStats indicated that the leading cryptocurrency had dropped 0.46% over the past 24 hours. Consequently, BTC was changing hands at $26,510.43 at press time.
Meanwhile, data from the cryptocurrency price tracking website CoinStats indicated that the leading cryptocurrency had dropped 0.46% over the past 24 hours. Consequently, BTC was changing hands at $26,510.43 at press time.
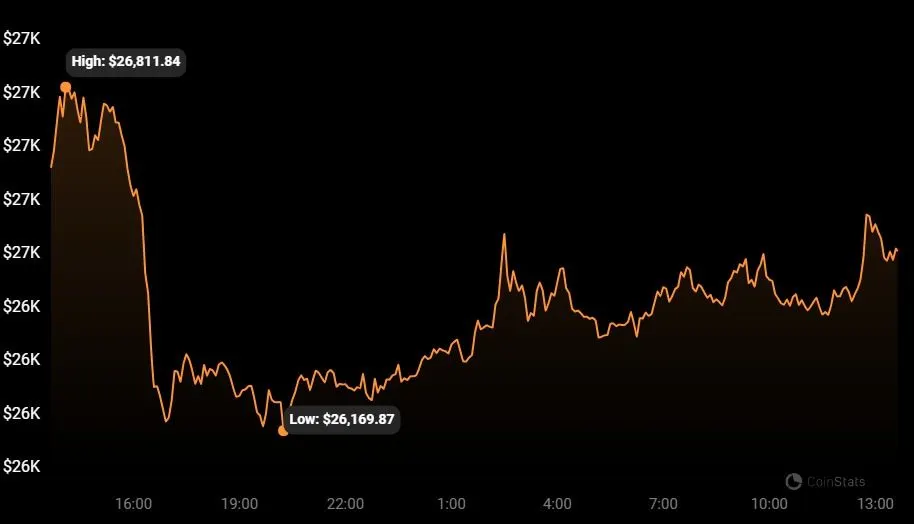
Price chart for BTC (Source: CoinStats)
BTC attempted to overcome the $27K resistance level during the past trading day. However, the cryptocurrency was only able to establish a 24-hour high at $26,811.84. Meanwhile, its daily low was established at $26,169.87.
Despite the slight retracement during the previous 24 hours, BTC’s performances on the longer time frames remained in the green. Data from CoinStats indicated that the cryptocurrency was up 1% over the past 14 days as well as over the past month. On the yearly time frame, the largest cryptocurrency in terms of market cap was up approximately 39%.
Bitcoin Miners Face Severe Challenges as Halving Looms
In related news, the leading analytics firm Glassnode has issued a grim prediction for Bitcoin miners in the wake of the cryptocurrency's next block subsidy halving in its latest edition of "The Week On-Chain." With the Bitcoin mining landscape becoming increasingly competitive and the hash rate reaching unprecedented highs, miners are expected to face severe challenges in sustaining their operations at current BTC price levels.
The record-breaking hash rate, representing the combined processing power dedicated to the Bitcoin blockchain, has set the stage for an unprecedented struggle among miners. Glassnode suggests that miners have been relying on transaction fees, which have seen a modest increase, to supplement their revenues. However, this growth in miner income from fees, ranging between 1% and 4%, remains relatively low by historical standards.
"The Week On-Chain" newsletter notes that the escalating hash rate, fueled by the entrance of more miners and the deployment of newer ASIC rigs, is laying the groundwork for an imminent showdown. This clash is expected to intensify in April 2024 when miner rewards per block are set to decrease by 50%, effectively doubling the "production cost" per BTC. The current production cost hovers around $15,000, but after the halving, it is projected to surge to over $30,000, exceeding the current spot price.
Glassnode has presented two models for estimating the price level at which miners, collectively, will begin operating at a loss. One model, which compares issuance to mining difficulty, indicates that the most efficient miners on the network have an acquisition cost of approximately $15.1k. However, a more concerning scenario emerges when considering the post-halving situation, where this level doubles to $30.2k. This significant increase in the acquisition cost is expected to place the majority of the mining market under severe income stress.
A previous model by Glassnode had estimated the average miner acquisition price at $24,300 per Bitcoin, which is approximately 8% below the current spot price as of today. These forecasts paint a challenging landscape for Bitcoin miners, highlighting the critical need for efficiency and cost-effective mining strategies as the halving event approaches. The cryptocurrency community will be closely watching the industry's response to these impending changes and their potential impact on the Bitcoin ecosystem.
Chainlink’s Impressive Performance Continues
Meanwhile, Crypto Tony also shared that Chainlink (LINK) may be an altcoin to keep an eye on in the short term given its impressive performance throughout the past few days. In a second post published during the past 24 hours, the analyst revealed that LINK’s price was approaching the key resistance level at $8.60. He also predicted that the altcoin’s price may break above this significant price point given the possible emergence of a medium-term bullish reversal pattern on LINK’s charts.
LINK was able to print a 24-hour gain of 1.75%, according to CoinStats. This added to the cryptocurrency’s positive streak over the past 7 days. At press time, the cryptocurrency price tracking website indicated that LINK was up a remarkable 16.04% for the week. This boosted the altcoin’s price to $7.77.
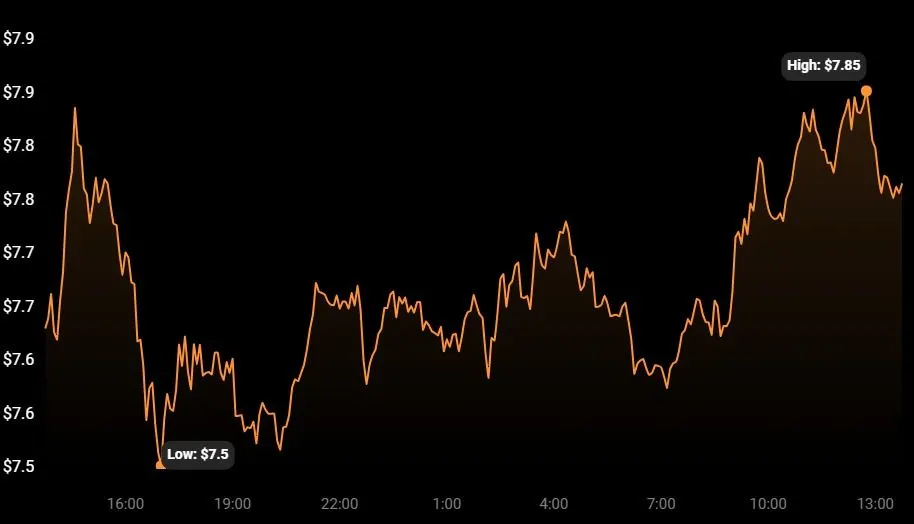
Price chart for LINK (Source: CoinStats)
LINK was also able to outshine BTC throughout the past 24 hours. At press time, LINK was up 2.27% against the market leader. Subsequently, the altcoin was estimated to be worth 0.00029348 BTC.

Daily chart for LINK/USDT (Source: TradingView)
From a technical point of view, a steep ascending price channel had formed on LINK’s daily chart after LINK consistently printed higher highs and higher lows over the past 2-3 weeks. During this period, the altcoin was able to flip both the $6.980 and $7.365 resistance levels into support. Furthermore, the cryptocurrency was still trading above both of these key price points at press time.
Should this strong bullish momentum continue, then it may only be a matter of time before LINK’s price breaches the next threshold at $7.940. Thereafter, the cryptocurrency could have the necessary foundation in place for it to rise to the $8.60 resistance level mentioned in Crypto Tony’s post.
Disclaimer: Coinpaper does not recommend that any cryptocurrency should be bought, sold, or held by you. Always conduct your own research and consult your financial advisor before investing in any digital asset.
