
The Federal Open Market Committee (FOMC) released the minutes for its meeting held between 25-26 July of this year. The minutes revealed that committee members were not able to reach a consensus regarding the continued pause of interest rate hikes since some members felt that inflation was still unacceptably high.
This uncertainty regarding interest rate hikes for the rest of the year sent ripples through the cryptocurrency market - leading to a market wide selloff. Subsequently, the combined market cap for the cryptocurrency market dropped below $1.115 trillion. The market leaders Bitcoin and Ethereum followed the same trend, and both suffered 24-hour losses. In addition to this, technical indicators for the cryptocurrency market suggested that sell pressure could continue in the coming week.
FOMC Minutes Suggest Another Rate Hike Is Looming
The newly-released minutes from the FOMC’s July 25-26 meeting have provided insights into the ongoing deliberations surrounding interest rates, inflation, and the broader economic outlook. As inflation remains a lingering concern, the question that looms large is whether another interest rate hike is in the cards.
Following the June pause in interest rate hikes, the Federal Reserve's recent minutes have unveiled a tapestry of viewpoints within the central bank. While some officials advocated for maintaining the status quo, the prevailing sentiment among members indicates a deep-seated apprehension about inflationary pressures. This has led to a willingness to consider further interest rate hikes as a tool to address the issue.
A pivotal takeaway from the minutes is that most participants perceive substantial upward risks to inflation. This perception has fueled discussions about the necessity of tightening monetary policy as a precautionary measure. The recognition of these inflation risks underscores the delicate equilibrium that the Federal Reserve must navigate: fostering economic growth while preventing runaway inflation.
The Federal Reserve's decision in July to raise the short-term benchmark fed funds rate by a quarter percentage point marked a significant departure from the preceding rate hike pause. The new target range of 5.25% to 5.50% was the highest level witnessed in over two decades. This decision mirrored the central bank's commitment to addressing inflation concerns in an evolving economic landscape.
Amidst these considerations, the minutes also shed light on an interesting dynamic – the acknowledgment of certain signs indicating potential relief from inflation pressures. Committee participants acknowledged a softening in core goods prices and identified tentative indications that inflation pressures might be cooling down. This perspective reflects the central bank's commitment to analyzing a range of economic indicators before making decisions that could impact the economy.
However, the cautious optimism concerning cooling inflation did not diminish the central concern voiced by committee members. The minutes highlighted that despite these positive signals, inflation was still deemed "unacceptably high." This phrase underscores the Federal Reserve's resolute stance on maintaining price stability and upholding its mandate of fostering maximum sustainable employment.
The deliberations of the Federal Reserve hold significant sway over market expectations, and investors are keeping a keen eye on the central bank's next move. As the minutes suggest, speculation about whether another rate hike pause is imminent has been fueled by the words of Federal Reserve Chair Jerome Powell. His comments in July indicated that the central bank's actions could swing in either direction. He stated, “it's certainly possible we would raise (rates) again at the September meeting and it's also possible we would hold steady."
In a world characterized by economic uncertainties, the Federal Reserve's role as a stabilizing force comes to the forefront. The ongoing debates within the central bank underscore the complex web of considerations involved in setting interest rates. Striking the right balance between supporting economic recovery and addressing inflation concerns remains an intricate challenge.
As the calendar marches forward, the upcoming meetings of the Federal Reserve will offer insights into the trajectory of monetary policy. The choice between another rate hike or a continued pause will hinge on the evolving economic data and the central bank's assessment of the inflation landscape.
Cryptocurrency Market Experiences a Selloff
The global cryptocurrency market cap (TOTAL) took a somewhat steep dive over the past 24 hours and dropped more than 1.5% during this period. Consequently, the total stood at around $1.107 trillion at press time.
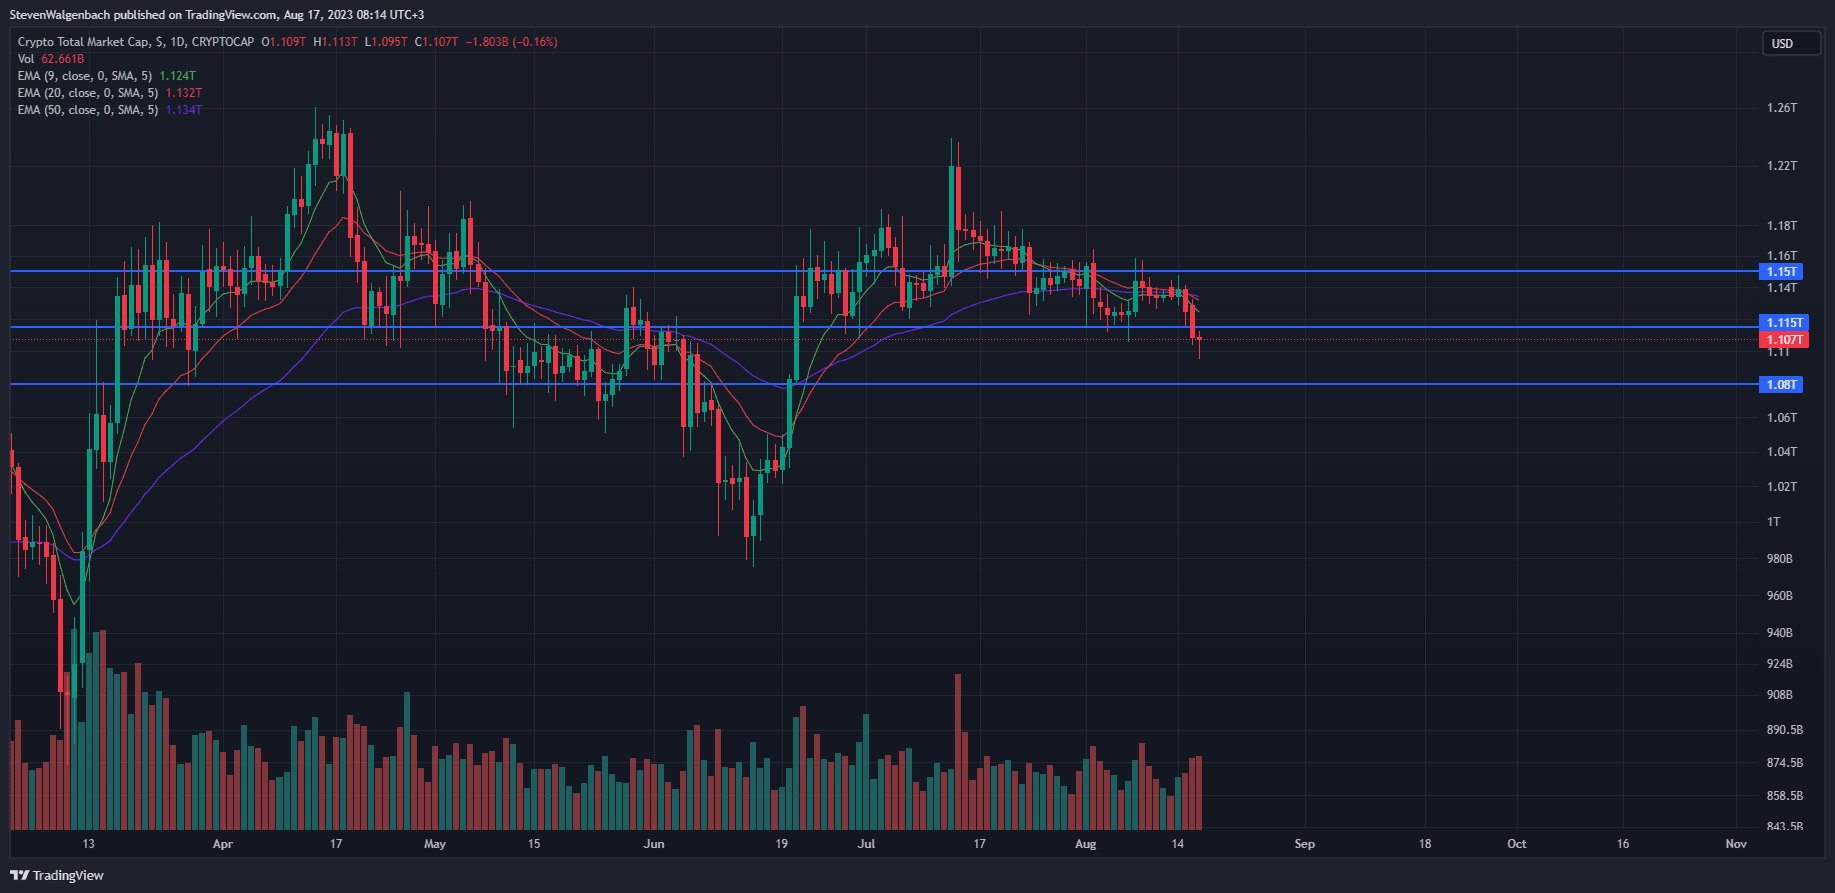
Daily chart for TOTAL (Source: TradingView)
From a technical perspective, the total dropped below the crucial $1.115 trillion support level over the past 48 hours. This was after TOTAL was rejected by the $1.15 trillion resistance on Monday. Since then, the collective cryptocurrency market cap has been in a strong decline. The biggest move in this period happened yesterday, however, as TOTAL suffered a 1.43% drop - resulting in the break below the $1.115 trillion support.
The cryptocurrency market cap may continue to drop in the coming 24-48 hours given the fact that a significant short-term bearish technical flag was triggered recently. The 20-day EMA line had crossed bearishly below the 50-day EMA line throughout the past 48 hours. This suggested that bears currently have the upper hand and may continue to exert selling pressure on the market. If this technical flag is validated, then the collective market cap of the cryptocurrency sector may fall to $1.08 trillion in the next couple of days.
BTC and ETH Break Below Crucial Support Levels
With regards to the 2 market leaders, Ethereum (ETH) and Bitcoin (BTC), both of the cryptocurrencies saw their price drop in the last 48 hours as well, according to CoinMarketCap. BTC was down 1.83% and ETH’s price had slipped 1.37%. As a result, the largest cryptocurrency in terms of market cap was changing hands at $28,617.84, while the leading altcoin’s price stood at $1,798.02 at press time. Meanwhile, their weekly performances were also both in the red zone. BTC was down 2.96% for the week and ETH printed a weekly loss of 2.79%.
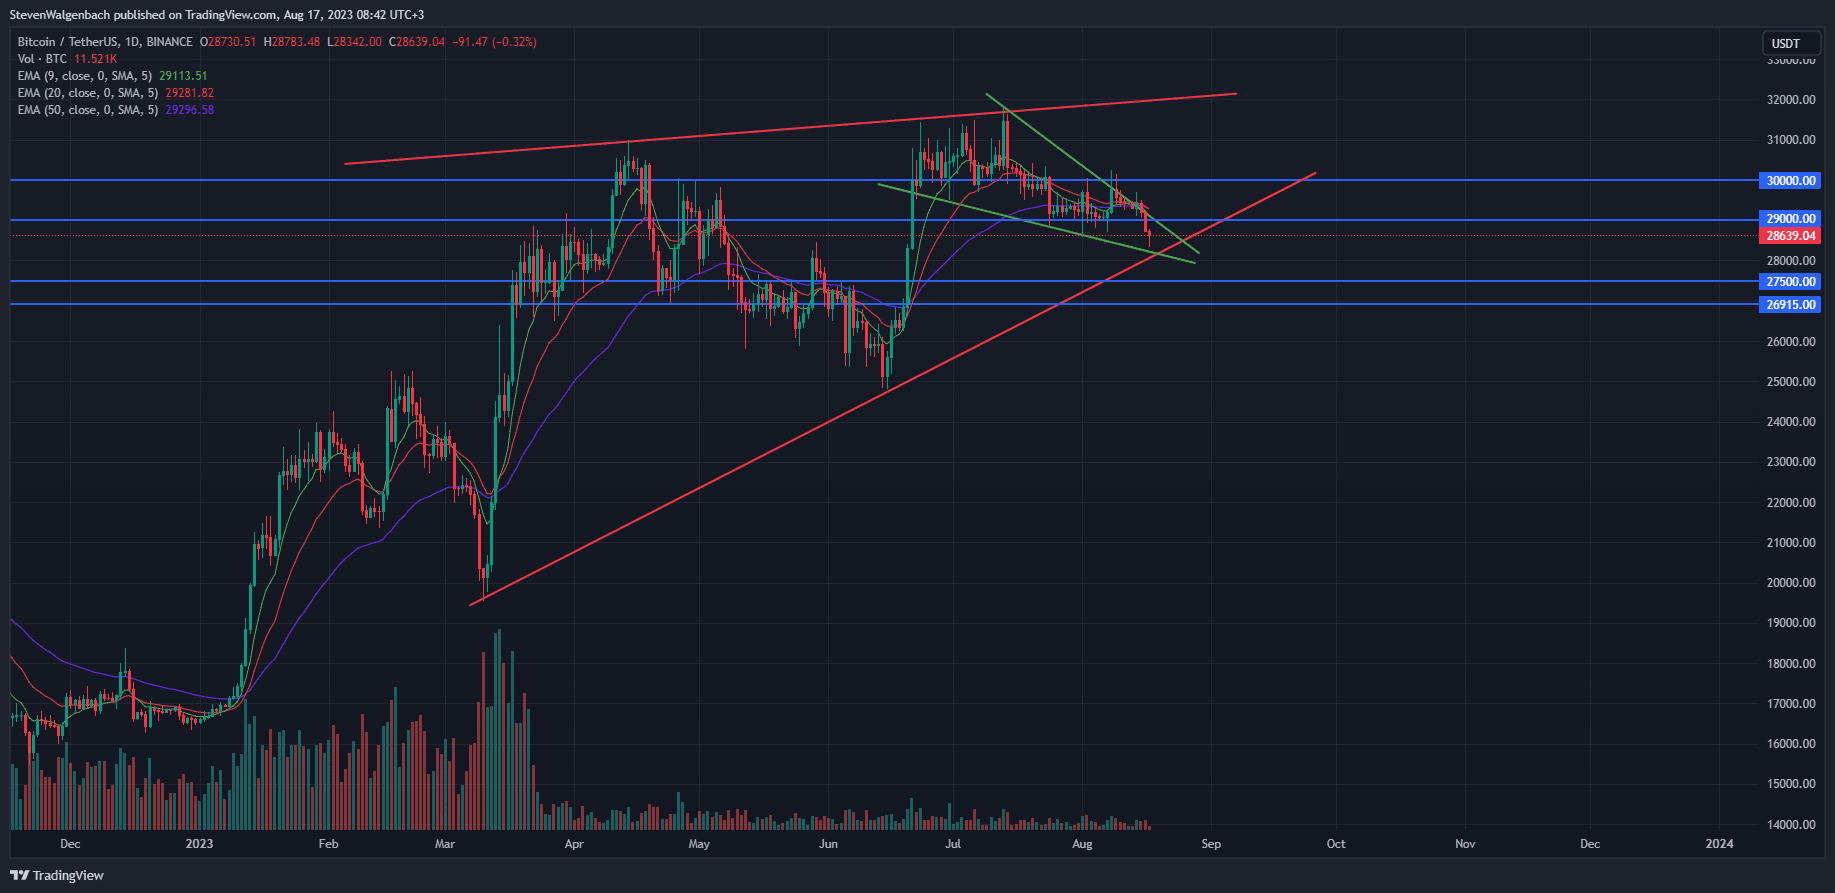
Daily chart for BTC/USDT (Source: TradingView)
A short-term bullish falling wedge and a medium-term bearish rising wedge had formed on BTC’s daily chart. Throughout the past week, the cryptocurrency’s price had attempted to break out of the bullish chart pattern to attempt to rise above $30K, but bears were able to tame BTC’s price and prevent the breakout.
The latest attempt at overcoming the chart pattern took place on Monday and was a failed attempt. This rejection from the upper level of the chart pattern resulted in a sharp drop in BTC’s price - causing it to lose the support of the 9, 20 and 50 EMA lines on its daily chart.
This price descent for BTC may continue in the coming week as technical indicators showed that momentum has flipped in favor of sellers. At press time, the 9-day EMA line was positioned below the 20-day EMA line, and both of these technical indicators were positioned below the 50-day EMA line. This suggested that BTC had entered into a short-term and medium-term negative trend and its price will most likely continue to fall.
If this bearish thesis is validated, BTC may look to challenge the lower level of the medium-term rising wedge pattern at around $28,215 in the coming week. A break below this level could then result in BTC dropping to $27.5K in the week thereafter. However, if the negative momentum continues, the cryptocurrency’s price may be at risk of dropping to $26,915 towards the end of this month.
This bearish thesis will be invalidated if BTC closes a daily candle above the $29K mark. In this scenario, the cryptocurrency’s price will likely attempt another move at breaking above $30K.
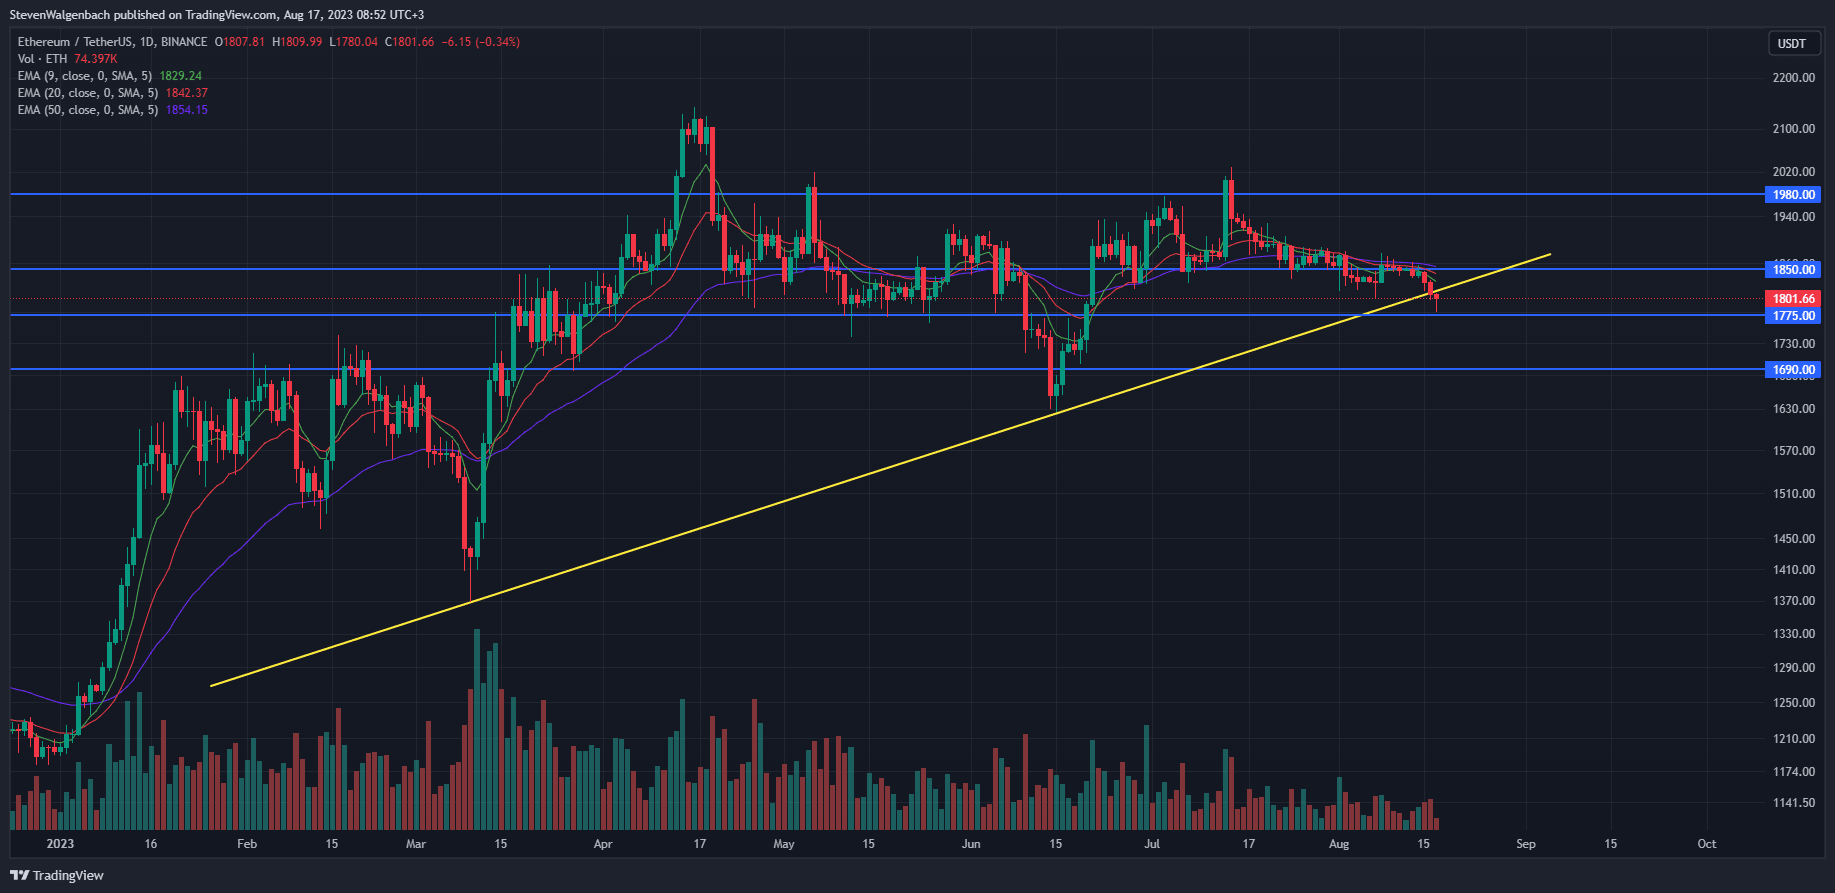
Daily chart for ETH/USDT (Source: TradingView)
ETH’s price dropped below a positive trend line on its daily chart over the past day of trading, where it continued to trade at press time. Similar to BTC, the altcoin’s price descent may continue in the coming week as short and medium-term momentum was in favor of sellers. This was evident by the orientation of the 9, 20 and 50 EMA lines on ETH’s daily chart.
ETH was also resting on the $1,775 support level at press time. If it closes today’s daily candle below this price point, then it may be at risk of falling to the next crucial mark at $1,690 in the following week. On the other hand, if it is able to rise back above the positive trend line on its daily chart, then it may look to reclaim a position above $1,850 as well.
A daily close above $1,850 will also mean that ETH’s price has flipped the 9, 20 and 50 EMA lines on its daily chart into support. This will then clear a path for the altcoin’s price to rise to $1,980 during the next few weeks.
