
Solana is holding near a key support area, with one chart showing SOL defending an ascending trendline and another showing price inside the $80 to $95 support zone. However, SOL still needs to reclaim the $115 area to confirm stronger recovery momentum and keep the larger $260 target in view.
Solana Holds Ascending Trendline as SOL Price Tests Key Support
Solana held above a key ascending trendline on the daily SOL/USDT chart, while the chart shared by CryptoJack on X showed buyers defending the same support line several times.
The chart shows SOL building higher lows along the rising trendline. That structure suggests buyers have stepped in each time the price returned to support. The latest move also shows SOL trading near the upper part of the recent range after bouncing from the same trendline area.

Solana Ascending Trendline Chart. Source: CryptoJack on X
CryptoJack said Solana could continue its upward momentum if SOL holds and confirms above the ascending trendline. That level now acts as the main short-term support. A clean hold above it could keep the bullish structure active and allow SOL to test higher resistance levels.
However, the setup still needs confirmation. SOL must stay above the trendline and avoid a daily close back below it. If sellers push the price under that support, the chart could shift toward a correction.
The candles near the right side of the chart show some hesitation after the recent move higher. That means buyers still need follow-through. Without stronger momentum, SOL may retest the trendline again before choosing a direction.
For now, Solana’s short-term trend depends on this support line. As long as SOL holds above the ascending trendline, the chart keeps the upward structure intact. A breakdown below it would weaken the setup and increase the risk of a pullback.
Solana Holds $90 Zone as SOL Price Trades Inside Major Support Area
Solana traded near $90 on the daily SOL/USDT chart, while the chart shared by Don on X showed SOL holding inside a long-term support zone.
The chart marks the current price area around $90.17. SOL has been moving sideways near this zone for more than 100 bars, showing that price has spent several months trying to form a base after the sharp decline from higher levels.
The green support band sits around the $80 to $95 area. This zone also acted as an important reaction area during earlier market cycles. That makes the current range important for Solana’s next larger move.
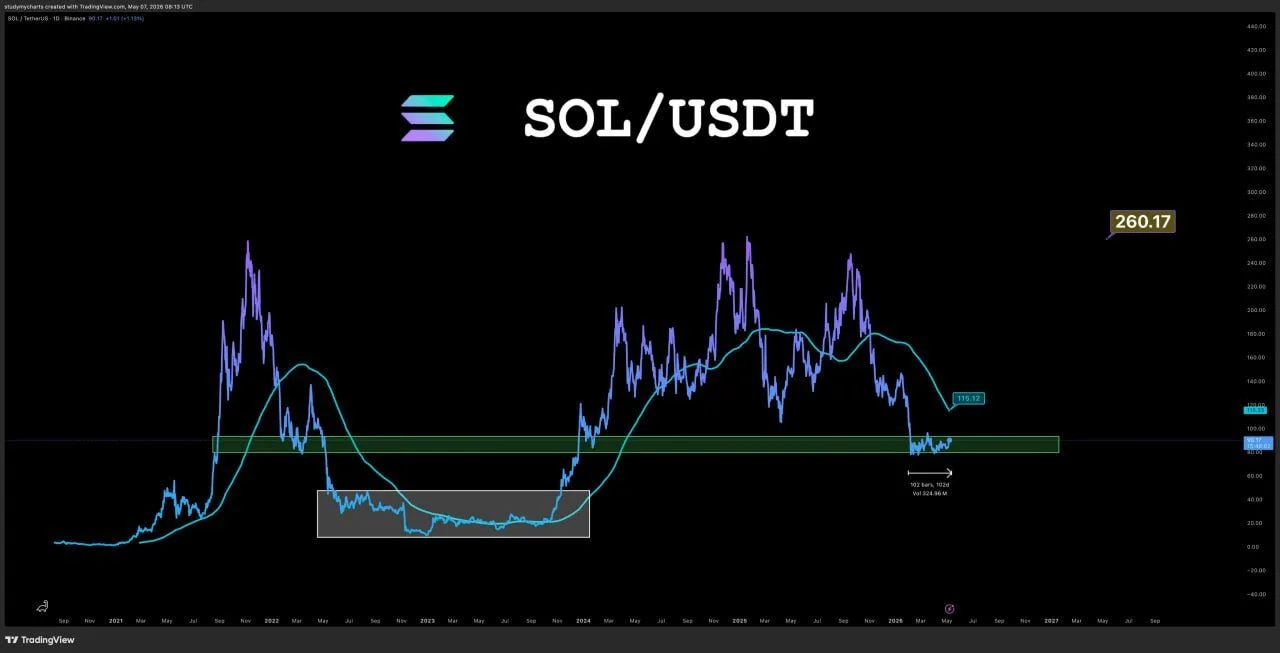
Solana Support Zone Chart. Source: Don on X
The chart also shows a moving average near $115.12 above the current price. SOL needs to reclaim that level to show stronger recovery momentum. Until then, the price remains below a key trend level and inside a wider consolidation phase.
The upside target marked on the chart sits near $260.17. That level is far above the current price and appears to match the previous high area. However, SOL would first need to break above $115, then build strength through several resistance zones before that target becomes active.
For now, Solana’s main test is the $90 support zone. A clean hold above this area could keep the base-building structure intact. However, a breakdown below the green band would weaken the setup and increase the risk of a deeper pullback.
