
Ethereum is stuck between short-term weakness and a larger bullish setup, as ETH failed again near $2,400 while another chart points to a possible long-term move toward $4,900 and $8,300. The next move now depends on whether buyers can reclaim resistance or whether weak spot demand pushes ETH back toward support.
Ethereum Price Fails at $2,400 as Weak Spot Demand Keeps ETH Under Pressure
Ethereum failed again to hold above the $2,400 level, keeping ETH price under pressure on the daily chart shared by Ted on X.
The ETH/USDT chart shows Ethereum trading near $2,336 after another rejection around the $2,400 resistance zone. The level has acted as a key barrier since April, with buyers failing several times to turn it into support.

Ethereum Price Resistance Chart. Source: Ted on X
The chart shows the main resistance area between about $2,400 and $2,430. ETH needs a clean daily close above that zone to open the way toward the next marked level near $2,624. If buyers push price above that line, the chart points to a possible move toward the $2,740 to $2,800 area.
However, Ted said spot demand remains weak. That matters because weak spot buying often limits follow-through after short rallies. In this case, Ethereum moved higher from the April low but lost strength near resistance instead of breaking through it.
The chart also shows a support area near $2,160 to $2,200. If ETH fails to break above $2,400, sellers may push the price back toward that green support zone. A deeper rejection could bring the lower support area near $1,740 to $1,800 back into focus.
Ethereum’s structure remains mixed. The April recovery created higher short-term lows, but ETH still trades below the major resistance zones from late 2025 and early 2026. The $2,400 level now decides the next short-term move.
For now, ETH needs stronger spot demand and a confirmed breakout above $2,400. Without that, Ethereum may continue to underperform while price stays trapped between resistance and support.
Ethereum Chart Points to $4,900 Retest as ETH Forms Bullish Reversal Setup
Ethereum traded near $2,335 on the weekly ETH/USDT chart, while the chart shared by Ray on X showed a possible bullish reversal structure forming above a long-term rising trendline.
The chart marks an inverse head and shoulders pattern. The left shoulder formed after Ethereum pulled back from its 2025 high. The head formed near the deeper 2026 low, while the right shoulder appears to be forming as ETH recovers from that area.
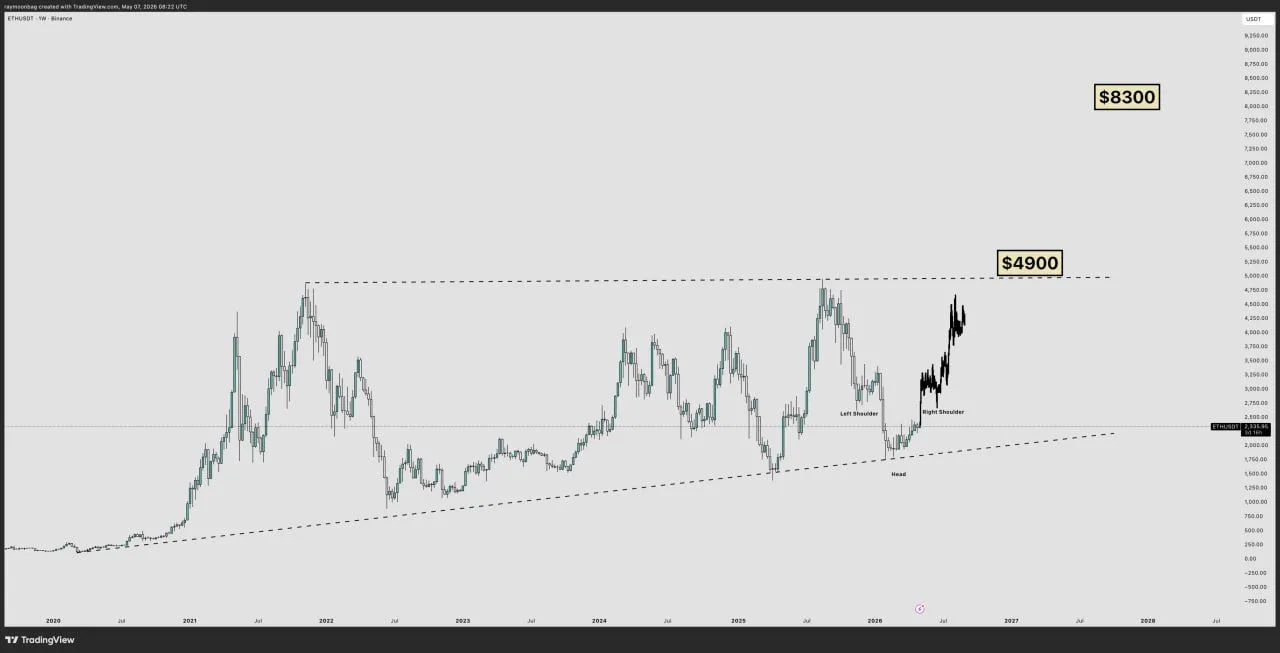
Ethereum Bullish Reversal Chart. Source: Ray on X
This structure matters because inverse head and shoulders patterns often show a shift from selling pressure to renewed buying. However, the setup still needs confirmation. ETH must continue holding above the rising trendline and push through the upper resistance area.
The first major target on the chart sits near $4,900. That level matches the previous high zone, where Ethereum faced rejection before. A move toward $4,900 would mean ETH has reclaimed the main breakout area and returned to its prior peak range.
The chart also marks a higher target near $8,300. That level appears as a later upside projection if Ethereum breaks above the $4,900 resistance and holds momentum. For now, that target remains a longer-term scenario rather than a confirmed move.
The key support remains the long-term rising trendline under the current structure. If ETH loses that trendline, the bullish setup would weaken. However, as long as price stays above it, the chart supports the view that Ethereum may be building a base for another move higher.
Ethereum’s next major test is the $4,900 resistance zone. A confirmed weekly breakout above that level would strengthen the bullish case and open the chart toward the higher marked target near $8,300.
