
Solana’s derivatives market kept flashing risk signals as funding stayed negative for more than two weeks. At the same time, SOL tried to stabilize near $80 after breaking down from a long held trading range.
Prolonged negative funding marks rare futures positioning
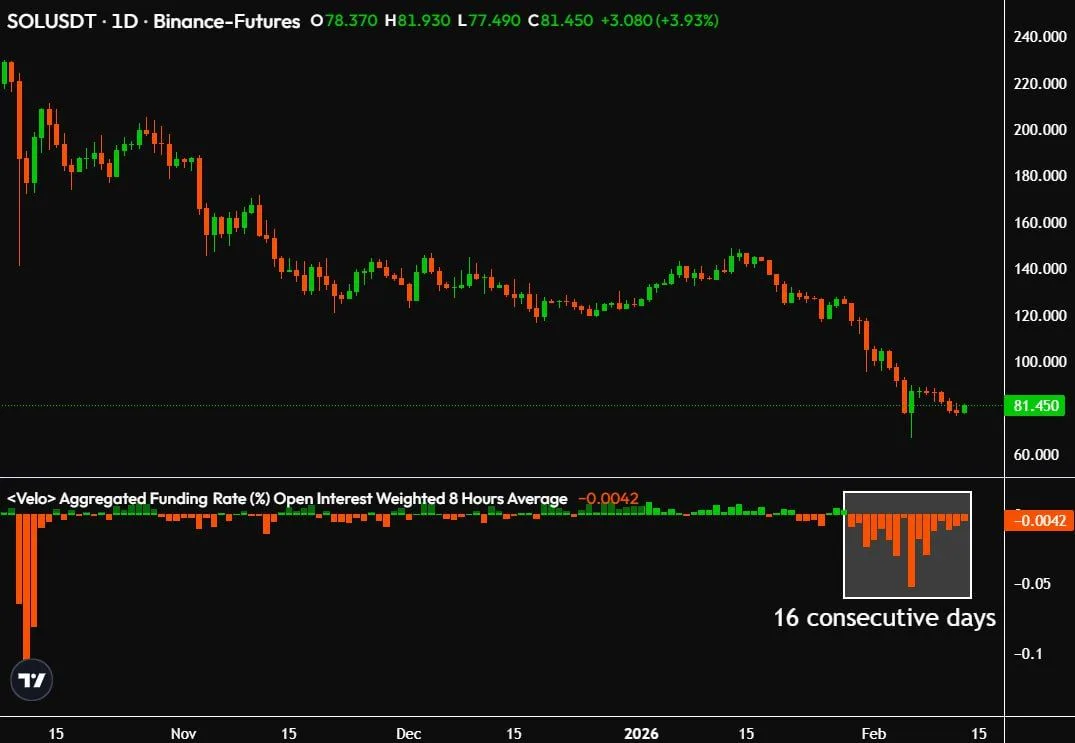
Solana futures funding rates stayed negative for 16 consecutive days, according to an aggregated open interest weighted eight hour average shown on a Binance Futures daily chart dated Feb. 15. The metric printed near minus 0.0042, which signals that short positions paid longs to hold exposure. Meanwhile, SOL traded near $81 on the daily chart, after extending a multi week decline that began in late 2025.
Solana U.S. Dollar Daily Chart. Source: TradingView / X
Funding rates reflect the balance of long and short demand in perpetual futures. Therefore, sustained negative readings point to traders leaning short across venues. In this case, the streak reached a level that has appeared only twice in Solana’s trading history, based on prior cycles cited by market participants. Those earlier stretches occurred in November 2022, when SOL traded near $8 during a broad market selloff, and in September 2023, when price hovered near $20 amid weak sentiment.
At the same time, price structure remained under pressure. SOL continued to post lower highs and lower lows on the daily timeframe, while rebounds stalled below former support that now acts as resistance. As a result, sellers kept control of the trend, and spot price held near the lower end of the recent range. The latest session showed a modest daily bounce, yet the broader structure stayed weak relative to prior months.
However, extended negative funding can signal crowded short positioning. When shorts dominate for long periods, forced covering can occur during sharp rebounds, which can amplify short term moves. Still, funding alone does not define trend direction. Instead, it adds context to derivatives positioning as price tests lower levels.
Price slips under former support while futures positioning stays cautious
Solana hovered near the $80 level on the three day SOL/USDT chart from Binance dated Feb. 13, after a sharp breakdown from a long held range that had supported price through much of 2024 and 2025. The latest candles showed SOL trading near $81, following a steep selloff that pushed price below the green support band around the low $120s. As a result, the broader structure shifted lower after price failed to hold the prior consolidation zone.
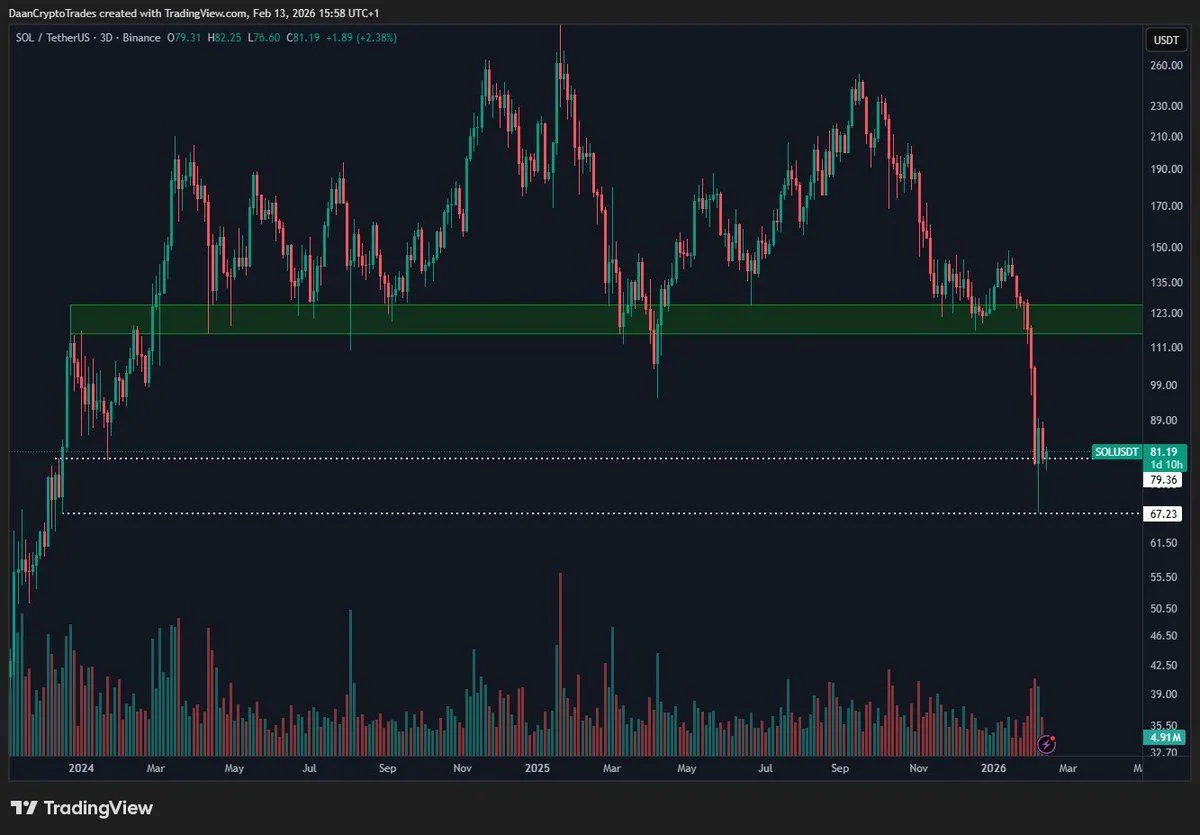
Solana TetherUS Three Day Chart. Source: TradingView (DaanCryptoTrades)
The chart showed multiple failed rebounds from the former range before the breakdown accelerated into early 2026. After that move, price extended lower toward the high $70s, where buyers began to defend the area. Therefore, the $80 zone now sits near the lower boundary of the recent decline, with the next visible reference band marked around the high $60s on the chart.
At the same time, volume expanded during the breakdown, which aligned with the strongest red candles in the sequence. That pattern reflected heavier sell pressure as price moved away from the prior range. However, recent candles printed longer lower wicks near $80, which showed buying interest at that level even as the broader trend stayed weak.
So far, price has not reclaimed the former range. Instead, SOL remains below the broken support, which now acts as overhead resistance. Until price holds above that zone, the structure stays tilted to the downside on higher timeframes. Short term stabilization near $80 would mark the first pause after the drop, while failure to hold the area would expose the lower band highlighted on the chart.
