
21Shares confirmed a new staking rewards distribution for its Solana ETF, TSOL, as SOL attempts to stabilize near critical support. The firm announced a $0.316871 per share payout tied to staking rewards generated from underlying SOL holdings.
The ex and record date falls on February 13, 2026. Investors will receive payment on February 17, 2026. Besides reinforcing ETF yield mechanics, the update arrives as Solana’s price rebounds sharply from recent lows.
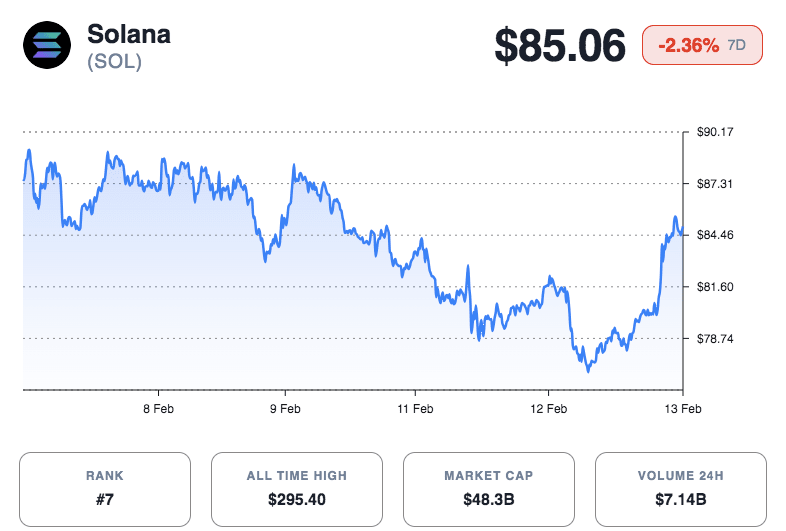
Solana trades at $85.06, posting a 9.04% gain over the past 24 hours. However, the token still shows a 2.36% weekly decline. Trading volume has climbed above $4.1 billion, reflecting renewed market activity.
Additionally, Solana maintains a circulating supply of 570 million tokens. Consequently, its market capitalization stands near $47.9 billion.
Analysts Outline Short-Term Recovery Scenario
Hamza noted that SOL’s lower timeframe structure suggests Wave B likely ended near the 50% Fibonacci retracement. Price reacted strongly from the $76–$78 region, forming a double zigzag pattern.
Hence, short-term momentum has shifted upward. Hamza sees potential upside targets at $89.5, followed by $97. An extended move could test the $100–$102 resistance zone.
Immediate support rests between $81.5 and $80. However, $76 remains the key invalidation level. A break below that threshold would negate the bullish outlook.
Source: X
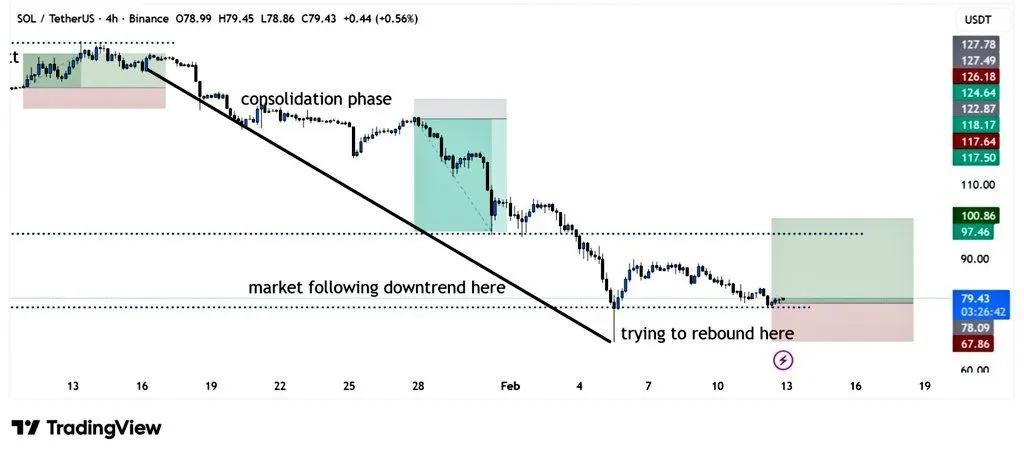
BitGuru offered a broader perspective on trend direction. He stated that SOL remains in a clear downtrend after breaking below consolidation. Price now hovers near the $78–$80 support area. If buyers defend this level, a rebound toward $95–$100 could follow. Conversely, failure to hold support would likely trigger renewed downside pressure.
Weekly Momentum Signals Extreme Conditions
James highlighted unusual momentum readings on the weekly chart. He observed that weekly RSI has dropped to its lowest level on record.
Moreover, MACD prints its second lowest reading in history. These indicators reflect intense bearish pressure. Historically, such extremes have preceded either sharp reversals or capitulation phases.
Significantly, SOL previously failed to sustain momentum above the $200–$210 resistance zone. The broader corrective structure remains intact. Consequently, traders continue to monitor whether current support can hold.
