
Solana faced mixed signals on Feb. 12 as a popular trader warned of a $50 drop while DeFiLlama data showed a new record for SOL locked in DeFi. The contrast put price weakness and onchain positioning in the spotlight at the same time.
Altcoin Sherpa flags $50 risk as Solana breaks key support
A crypto trader known as Altcoin Sherpa warned on X that Solana could fall toward $50 if it fails to hold a key price level, after SOL slipped sharply on the daily chart. The post came as Solana traded near $77 on Binance on Feb. 12, down more than 11% on the session, according to TradingView data shared by the analyst. The chart showed a strong selloff that pushed price below a long-watched horizontal support zone near the mid-$90s.
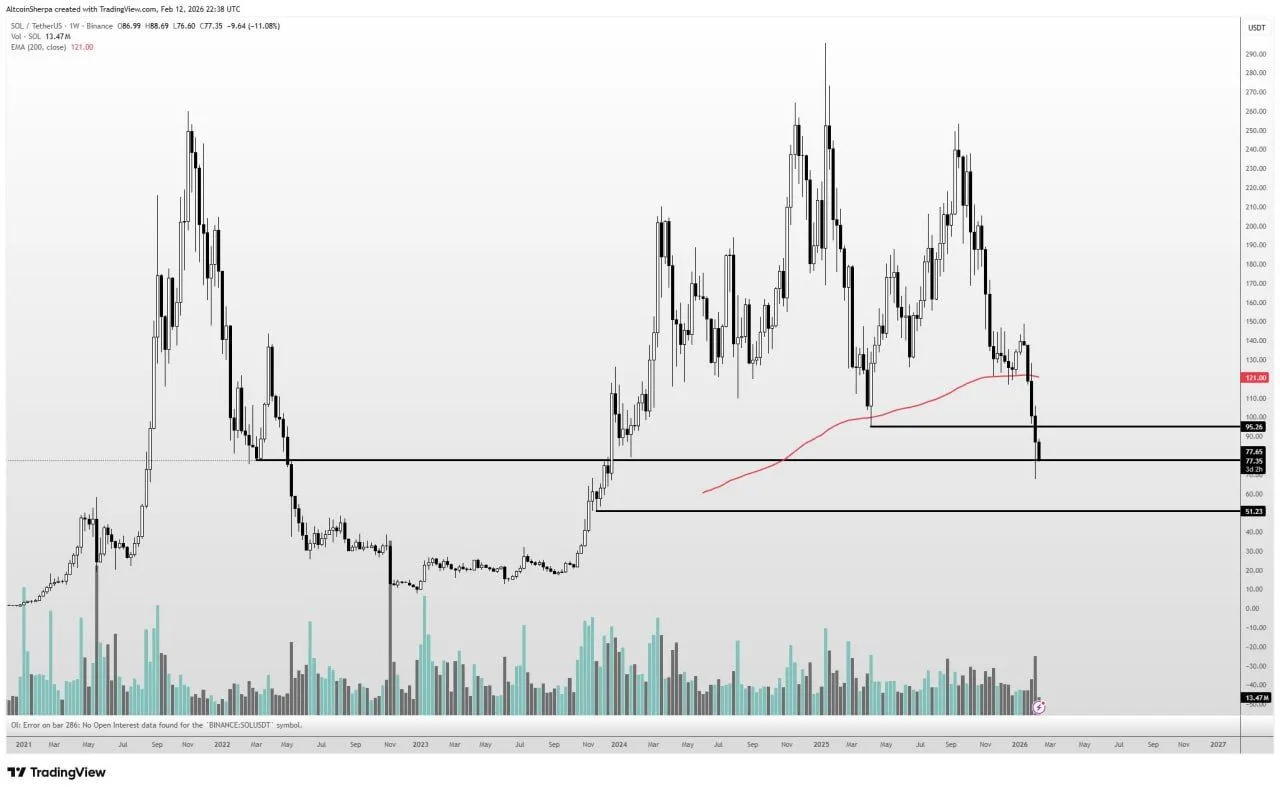
Solana U.S. Dollar Daily Chart. Source: TradingView (Altcoin Sherpa)
The TradingView chart, created at 22:38 UTC on Feb. 12, showed SOL breaking below a prior floor near $95. As a result, that zone now acts as resistance. Price also moved well below the 200-day exponential moving average, which sat near $121 on the chart. The loss of that moving average confirms that price remains in a broader downtrend on the higher timeframe. In addition, the latest candle printed a long downside wick, which signals sharp intraday selling pressure before a partial rebound.
The structure on the chart shows that the $95 area previously acted as support during multiple pullbacks in 2024 and early 2025. However, once price closed below that level, buyers failed to reclaim it on the rebound. Therefore, the market now treats the former floor as overhead resistance. Below the current price, the next marked support zone sits near the high-$70s, followed by a lower band around $51. That lower level aligns with Altcoin Sherpa’s comment that Solana could move toward $50 if the current support fails to hold.
The analyst framed the level as a critical line for market structure rather than a short-term target. In earlier cycles, similar breaks of multi-month support zones led to extended downside phases before price found a stable base. Meanwhile, volume on the chart increased during the breakdown, which shows stronger participation on the sell side. As a result, the move reflects broader weakness rather than a brief volatility spike.
Solana Sensei cites new high in SOL locked across DeFi
Meanwhile, A crypto commentator posting as Solana Sensei said on X that Solana has reached a new all time high in SOL locked across decentralized finance, pointing to a DeFiLlama chart that tracks total value locked denominated in SOL. The post argued that users are accumulating SOL and using it onchain, linking the rise in locked tokens to higher activity across Solana based DeFi.
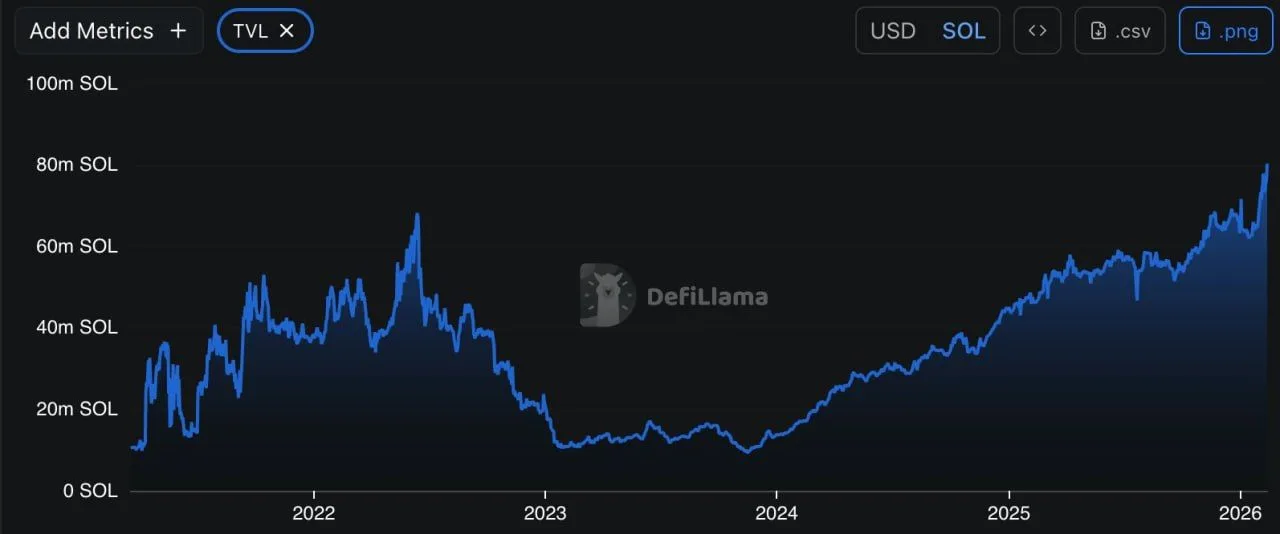
Solana DeFi TVL in SOL Chart. Source: DeFiLlama (Solana Sensei)
The chart shows SOL denominated TVL climbing through 2024 and 2025, then pushing to a fresh peak in early 2026. On the y axis, the metric ranges up to 100 million SOL, while the latest reading sits near the top of the scale, around the high 70 million to roughly 80 million SOL area. That level exceeds the earlier cycle peaks visible in 2021 and 2022, when the metric rose sharply before dropping into 2023.
Because the chart measures TVL in SOL rather than dollars, the increase can reflect more tokens deposited into DeFi protocols, not only price moves. As a result, the new high suggests that more SOL units sit inside DeFi apps than at prior peaks. However, the chart alone does not separate deposits from shifts in how protocols count locked assets, so the figure still needs protocol level context to explain what drove the jump.
