
Bitcoin completed a key technical move on January 21 by filling its lower CME gap near $88,000, while on-chain data showed large holders increasing exposure. At the same time, a $132,000 price projection gained attention, adding to mixed signals as the market stabilizes after the recent drop.
Bitcoin Fills CME Gap as Price Tests $88,000 Area
Bitcoin closed its lower CME futures gap on January 21, according to a 30 minute CME chart shared by More Crypto Online. Price sold off from the mid January peak near $98,000 and pushed into the highlighted gap zone around $88,000–$89,000, then stabilized.
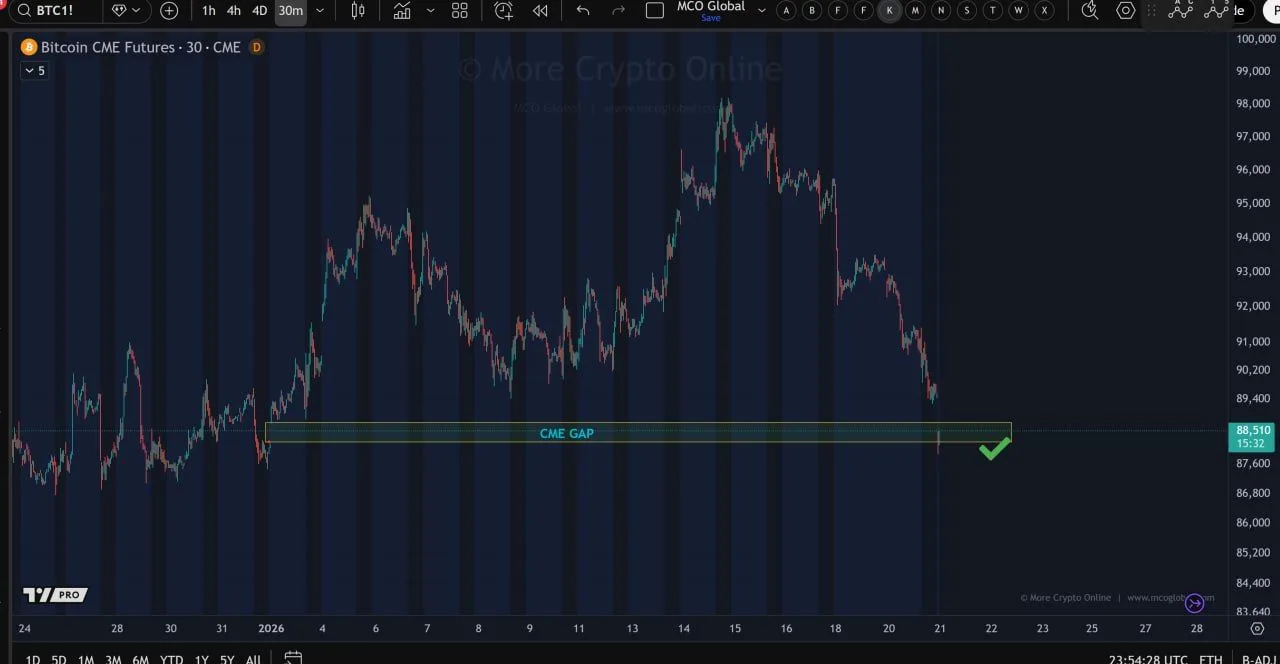
Bitcoin CME Futures 30 Minute Chart. Source: More Crypto Online
The chart shows Bitcoin breaking below the $95,000–$96,000 area and sliding into the gap without long pauses. The move formed a clear short term downtrend, with successive lower highs and lower lows into the fill zone.
After price reached the gap, it briefly dipped under the lower boundary and then moved back into the highlighted range. That reaction suggests selling pressure slowed once the gap closed, although the structure still sits below prior swing levels.
With the gap now filled, attention shifts to nearby resistance and whether price can reclaim broken levels. The $90,000–$92,000 zone stands out because it overlaps with the post drop consolidation area on the chart. If buyers hold the gap zone and push above that band, price can build a base. If price loses the gap zone again, the market can probe lower support levels around $87,000–$86,000.
Klarck Targets $132,000 After BTC Rebounds From Early 2026 Lows
Meanwhile, Klarck posted on January 21 that Bitcoin will reach $132,000 within 60 days, calling the latest drop “over” and pointing to a Bitcoin USDT daily chart on Binance with rounded swing markers and an upward projection.
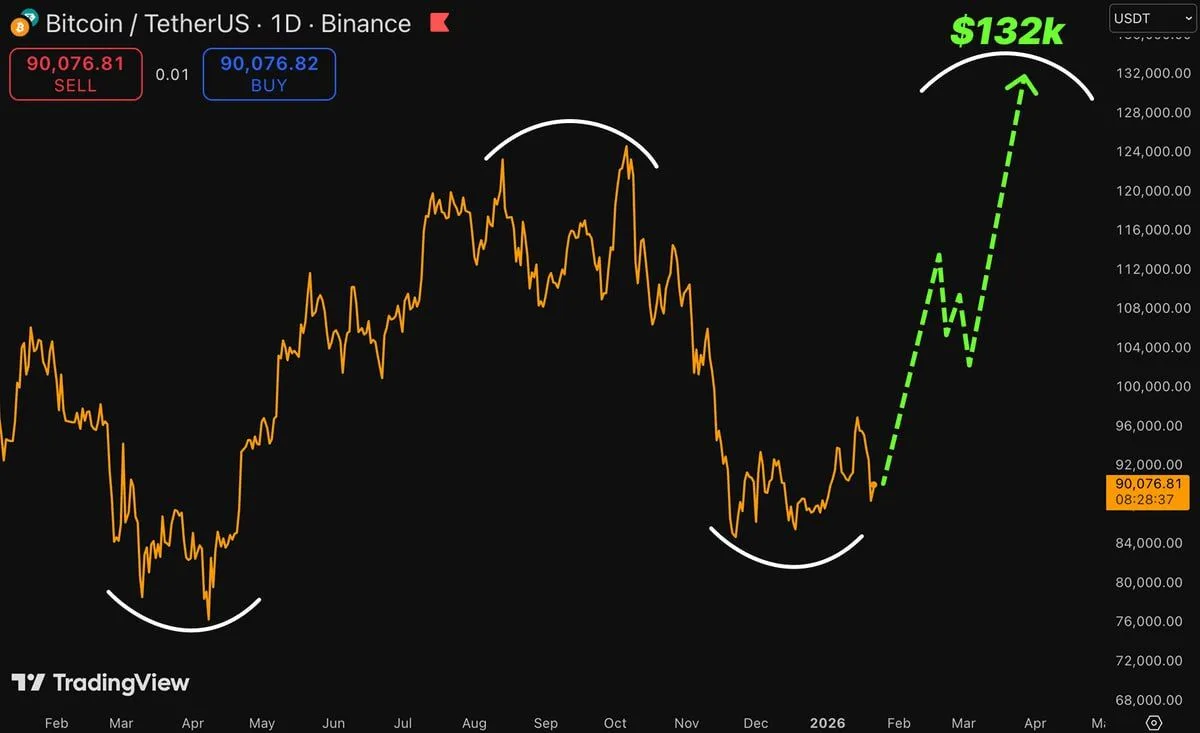
Bitcoin TetherUS Daily Chart, Binance. Source: Klarck (@0xklarck)
The chart shows Bitcoin trading near $90,076 at the time of the screenshot on TradingView. It also shows a sharp decline from late 2025 highs into a low around the mid $80,000s, followed by a bounce into the low $90,000s.
Klarck’s graphic adds a dashed path that first pushes price toward the $110,000–$116,000 area, then dips and continues higher. It ends at a labeled target of $132,000 on the right side of the chart.
The post frames the setup as a completed downswing and a fresh upswing, then ties that view to a fixed timeline. Still, the chart itself includes no indicators, levels, or event triggers, so the $132,000 figure reflects the author’s projection rather than a confirmed market move.
Bitcoin Whales Increase Holdings as 30 Day Balance Change Turns Positive
On January 21, on-chain data shared by Kamran Asghar shows large Bitcoin holders increasing balances over the past 30 days, even as price consolidation continues near recent highs.
The chart tracks balance changes for wallets holding more than 1,000 BTC, including mega whales and exchange-linked addresses. Recent readings show a sharp positive spike on the right side of the chart, signaling net accumulation during the latest period.
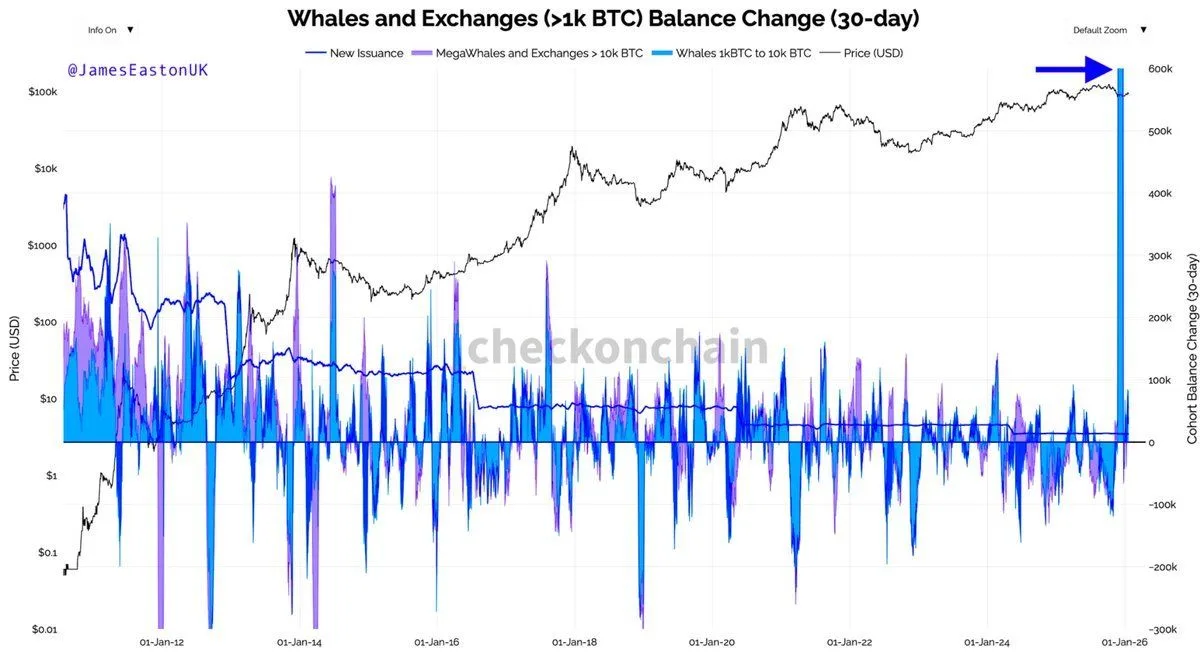
Whales and Exchanges Over 1k BTC Balance Change 30 Day Chart. Source: Checkonchain, James Easton UK
At the same time, Bitcoin’s price line continues to trend upward over the longer term, holding near the upper end of its historical range. The combination suggests large holders added coins while price remained elevated, rather than during deep drawdowns.
Smaller whale cohorts, holding between 1,000 BTC and 10,000 BTC, also show intermittent positive balance changes. That pattern points to broader participation among large wallets instead of isolated accumulation by a single group.
Historically, sustained positive balance changes among whale wallets have preceded periods of price expansion, especially when accumulation occurs during sideways or corrective phases. If the current trend persists, on-chain positioning suggests large holders are preparing for higher price levels rather than distribution.
