
Litecoin trades at $72.81 as of writing, posting a 2.58% daily decline and extending weekly and monthly losses. Market data places LTC down 9.64% over the past 7 days and 7.4% over the last 30 days. While major cryptos show relative stability, Litecoin continues to lag.
Traders now focus on whether the asset can defend its current level or faces deeper downside. This price zone matters. Why? Because recent market behavior converges around it.
Whale Activity Raises New Questions
On-chain data from Santiment highlights a notable spike in Litecoin whale activity. The Age Consumed index shows transactions above $100,000 rising to a five-week high of 503 on January 14. This increase aligned closely with Litecoin’s drop toward the $75 region. Large transfers often signal either accumulation or distribution. In this case, the direction remains unclear.
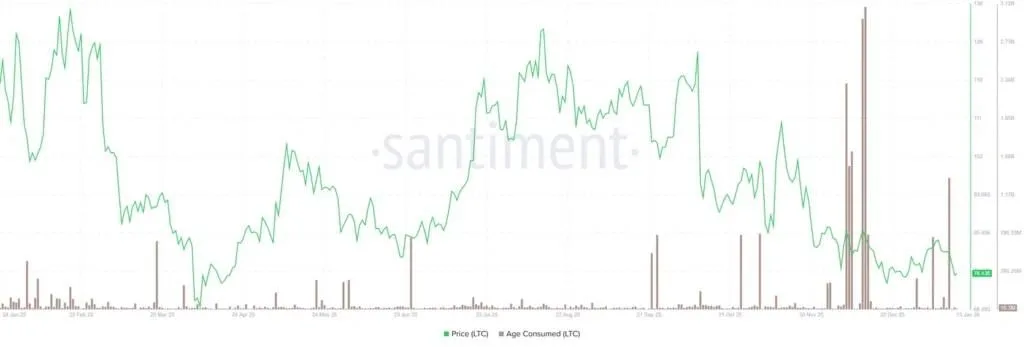
Source: Satiment/TradingView
Historical patterns offer context. Similar spikes in December 2025 coincided with local price tops. That history now adds psychological pressure, especially for retail participants monitoring whale behavior. Market observers track whether this activity reflects long-term positioning or short-term selling. The answer may shape Litecoin’s next move.
ETF Flows Signal Institutional Apathy
Institutional interest in Litecoin continues to show limited momentum. The Canary Capital Litecoin ETF recorded negative inflows for five consecutive sessions. In contrast, Solana-linked ETFs as of January 16th has attracted over $8 million, while XRP ETFs saw over $17 million in inflows over the same period. This divergence highlights how capital currently favors other large-cap digital assets.
Performance metrics reinforce that trend. Litecoin’s 60-day return stands near negative 25%, which discourages large allocators from rotating funds into the asset. Without sustained ETF demand, Litecoin lacks a key support pillar that has benefited peers. That absence leaves price action more sensitive to spot market flows.
Technical Structure Sits on a Knife’s Edge
Chart signals underline the importance of current levels. On the weekly timeframe, Litecoin trades within a clear bear flag pattern. This structure often precedes continuation moves when price breaks support. Right now, price action hugs the key support of that formation.
Traders watch the weekly close closely. A hold could invite a relief rally. A breakdown could accelerate losses.
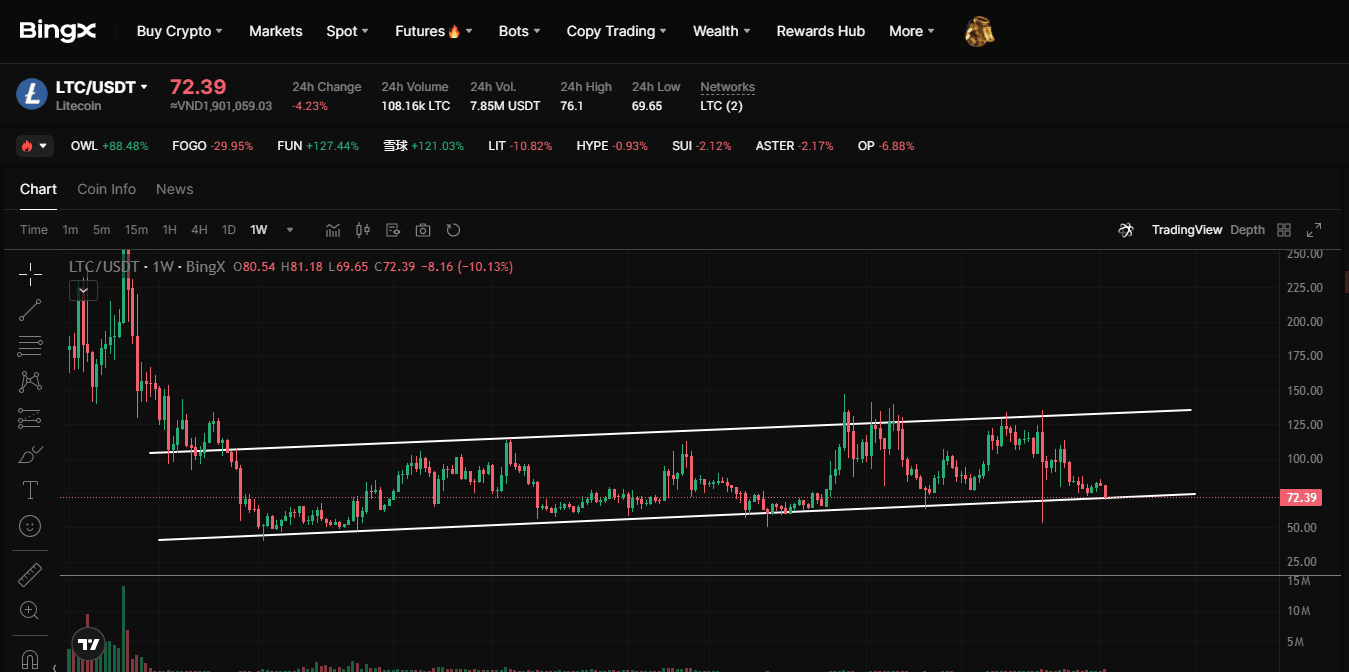
Source: Trading View via CMC
Immediate support rests near $72.76. A sustained move below that level may expose the $66 to $68 zone. In a more extreme scenario, analysts monitor the $50 region as a long-term downside reference.
On the upside, a recovery above $78.75, which aligns with the 50% Fibonacci retracement, may indicate renewed accumulation. Can Litecoin reclaim that level soon? The market will decide.
Medium-Term Outlook Hinges on Key Levels
Technical projections outline a defined path. A firm push through the $77 to $80 resistance range could open room toward $87 to $95 over the medium term. These levels align with prior congestion zones and historical reactions. However, price must first stabilize.
Forecast models from CoinCodex add perspective. Their latest projection suggests Litecoin could rise 34.7% toward $97.27 by April 2026, despite current bearish sentiment indicators.
The Fear and Greed Index reads neutral at 49, while recent volatility remains contained compared with prior cycles. Litecoin recorded 14 green days out of the last 30, reflecting mixed momentum.
As Litecoin tests a critical support zone, traders continue to watch on-chain metrics, ETF flows, and broader market dominance trends. Each factor now feeds into a narrow decision window. Will support hold, or does the chart demand another chapter lower? The coming sessions may offer clarity.
