
Ethereum broke out of its 12H descending channel, and as transaction counts hit a 2025 high, ETH held above $3,000 and aimed toward $3,410 next.
ETH breaks descending channel on 12H chart
The Ethereum–U.S. dollar pair pushed above the upper boundary of a descending channel that has guided price action since late summer. The breakout appeared on the 12-hour timeframe, where price also began to hold closer to the 50-period moving average. This move suggests sellers are losing control of the prior downtrend, at least in the near term.

Ethereum U.S. Dollar 12H Bitstamp Descending Channel Breakout. Source: Jonathan Carter (@JohncyCrypto)
Carter said the breakout confirms completion of the descending channel pattern. He pointed to follow-through buying after the move above trendline resistance as evidence of rising upward pressure. The chart shows Ethereum stabilizing above former channel resistance, which now acts as a short-term pivot area.
Based on the updated structure, Carter outlined upside reference levels derived from prior congestion and volume zones. He identified $3,410 as the first target, followed by $3,770 and then $4,250 if momentum continues. These levels align with earlier resistance areas where price previously stalled during the broader decline.
The analysis comes as Ethereum trades near the lower $3,000 range after weeks of consolidation. While the breakout shifts the immediate technical bias higher, continuation depends on whether price can sustain above the former channel boundary and nearby moving averages on subsequent candles.
Ethereum ecosystem sets late 2025 transaction peak
Ethereum-linked networks ended 2025 with a fresh high in transaction activity, as monthly counts climbed into year-end and extended a multi-quarter uptrend, according to a chart shared on X by analyst Leon Waidmann.
The chart tracks monthly transactions across major Ethereum-connected chains and shows the combined total rising steadily through 2024 before accelerating into 2025. The final bars of 2025 reach the highest level on the display, which supports Waidmann’s claim that the ecosystem closed the year at an all-time high for transaction count.
Most of the visible growth came from high-throughput networks tied to Ethereum’s scaling stack rather than Ethereum mainnet alone. In the legend, Base leads the last 30-day total, while Polygon PoS and Arbitrum also rank among the largest contributors. As activity broadened across these chains, the stacked bars thickened into late 2025, which indicates more transactions spread across several venues instead of a single-network spike.
The right edge of the chart also shows a sharp increase heading into early 2026, with the highest cluster of bars packed into the most recent months. That shape signals that transaction demand remained elevated after the year-end peak, while the ecosystem’s growth stayed concentrated in rollups and other execution layers that settle back to Ethereum.
Ethereum price path points higher into January
Ethereum’s rebound from the mid-December low near $2,850 shifts the short-term bias upward. Price reclaimed the $3,000 level and then extended toward $3,100, which now acts as the nearest pivot. As long as Ether holds above this zone, the structure favors continued upside rather than a return to December lows.
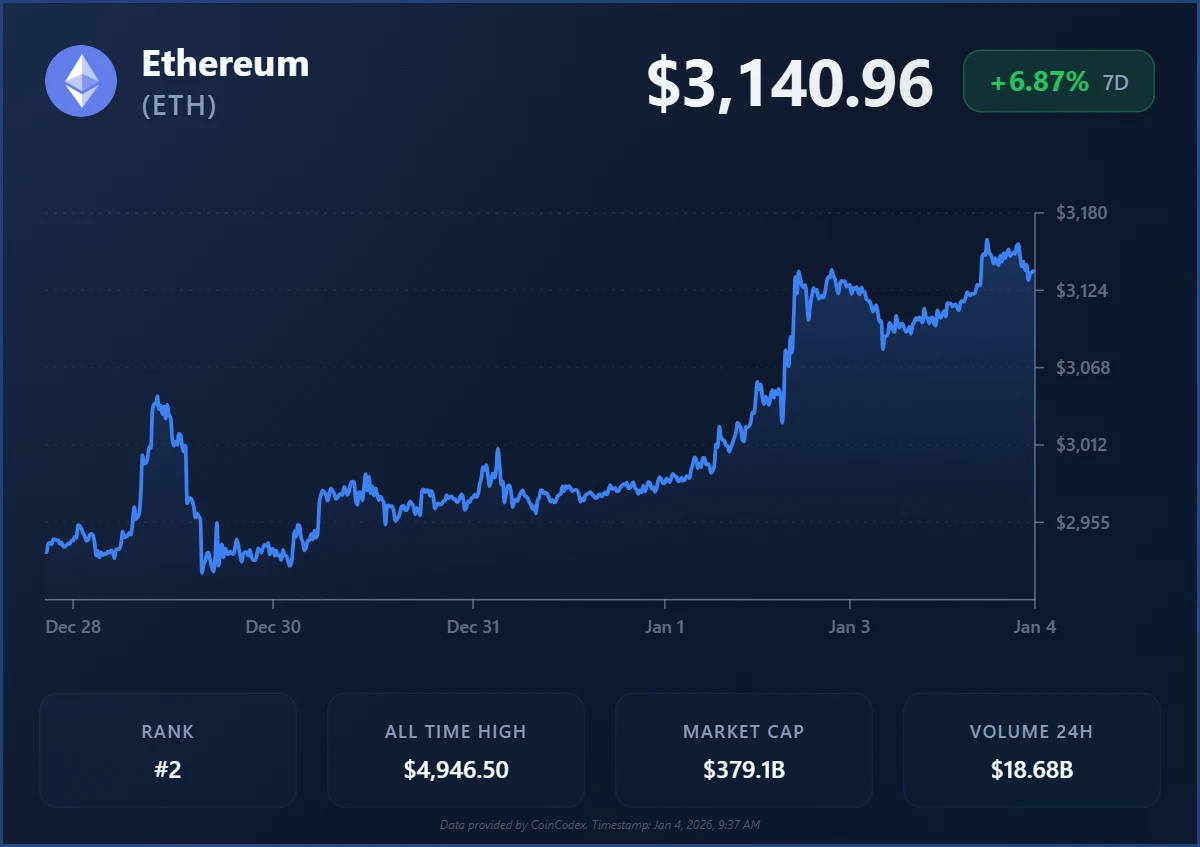
Ethereum Price USD, December 2025–January 2026. Source: CoinCodex
The slope of the recent move suggests momentum is rebuilding after a prolonged consolidation phase. Higher lows formed into late December, and the early January push shows follow-through instead of a single spike. If this pattern persists, price can probe the $3,250 to $3,300 area, where selling pressure capped earlier rallies in December.
The projected curve on the chart aligns with a continuation scenario rather than a sharp breakout. That implies gradual gains instead of a vertical move. Failure to hold above $3,000 would weaken this setup and reopen the $2,900 region, but current price behavior supports a higher range into mid-January.
