
Ethereum’s biggest holders are back in motion, moving old ICO coins while adding fresh Ether during recent volatility. At the same time, a developing inverse head-and-shoulders pattern on the weekly chart suggests Ethereum may be building a long-term bullish base.
Early Ethereum ICO Whale Moves Funds After 10,663x Gain
An early Ethereum ICO participant shifted a small portion of long-held coins, onchain data from Onchain Lens shows. The wallet, labeled “ETH Millionaire,” controls 850 Ether bought for about $264 during the token sale. At current prices, that stash is valued near $2.82 million, marking a 10,663x return on the original outlay.
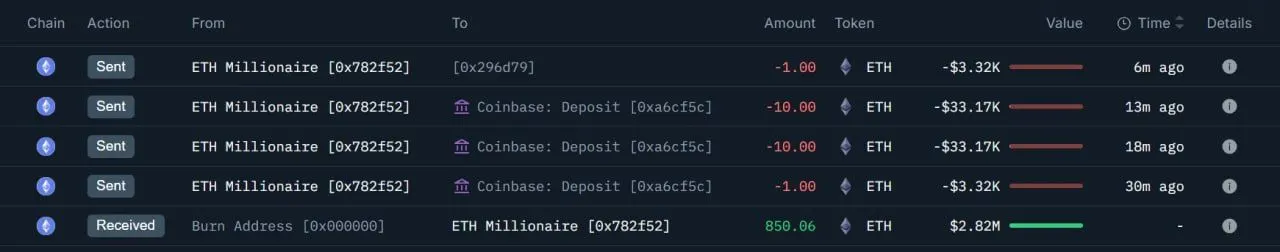
Ethereum ICO Whale Transfer. Source: Onchain Lens
In the latest activity, the address moved 22 ETH worth roughly $72,936. The holder sent 21 ETH to a deposit address linked to Coinbase and transferred 1 ETH to a fresh wallet. The remaining balance stayed in the original address, which still holds the bulk of the ICO-era coins.
The transactions add to ongoing tracking of early Ethereum investors who are gradually testing liquidity on exchanges. However, the movement so far represents only a small fraction of the whale’s total holdings, while most of the 850 ETH remains untouched onchain.
Ethereum Whales Add 800,000 ETH in One Month
Meanwhile, Ethereum whales quietly increased their holdings over the past month, onchain data from Santiment shows. Addresses holding between 10,000 and 100,000 ETH accumulated more than 800,000 coins during this period, even as price action stayed choppy. The chart from analyst Ali highlights how whale balances climbed while ETH moved through a wide trading range near the 3,000-dollar area.
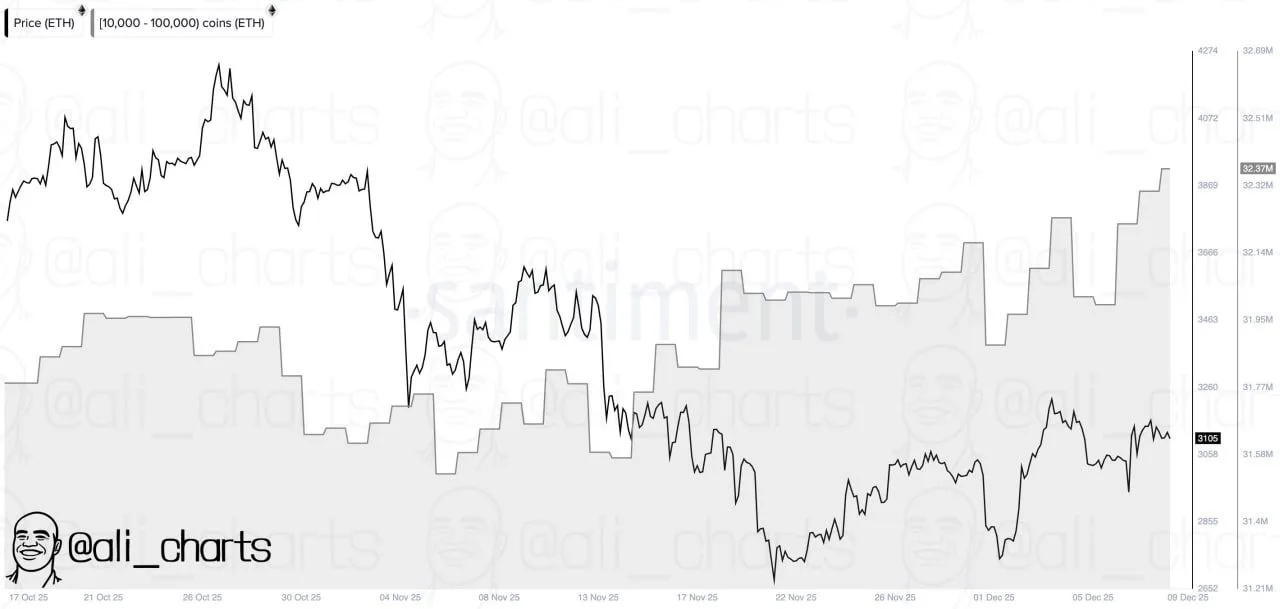
Ethereum Whale Accumulation Chart. Source: Ali Charts / Santiment
This steady accumulation signals that large holders continued to buy on dips rather than reduce exposure. As the line tracking whale supply pushed higher, the price line showed several sharp swings, with rallies fading and new lows forming before a recent bounce. Yet, through these moves, the total held by big wallets kept rising, suggesting that long-term players treated volatility as an entry opportunity instead of a reason to exit.
Ethereum Weekly Chart Maps Out Potential Inverse Head-and-Shoulders
Ethereum’s weekly chart is shaping a potential inverse head-and-shoulders pattern, analyst Merlijn The Trader noted on X. The structure shows a deep low in the middle, or “head,” flanked by two higher troughs that form the left and right shoulders under a long-term resistance line.
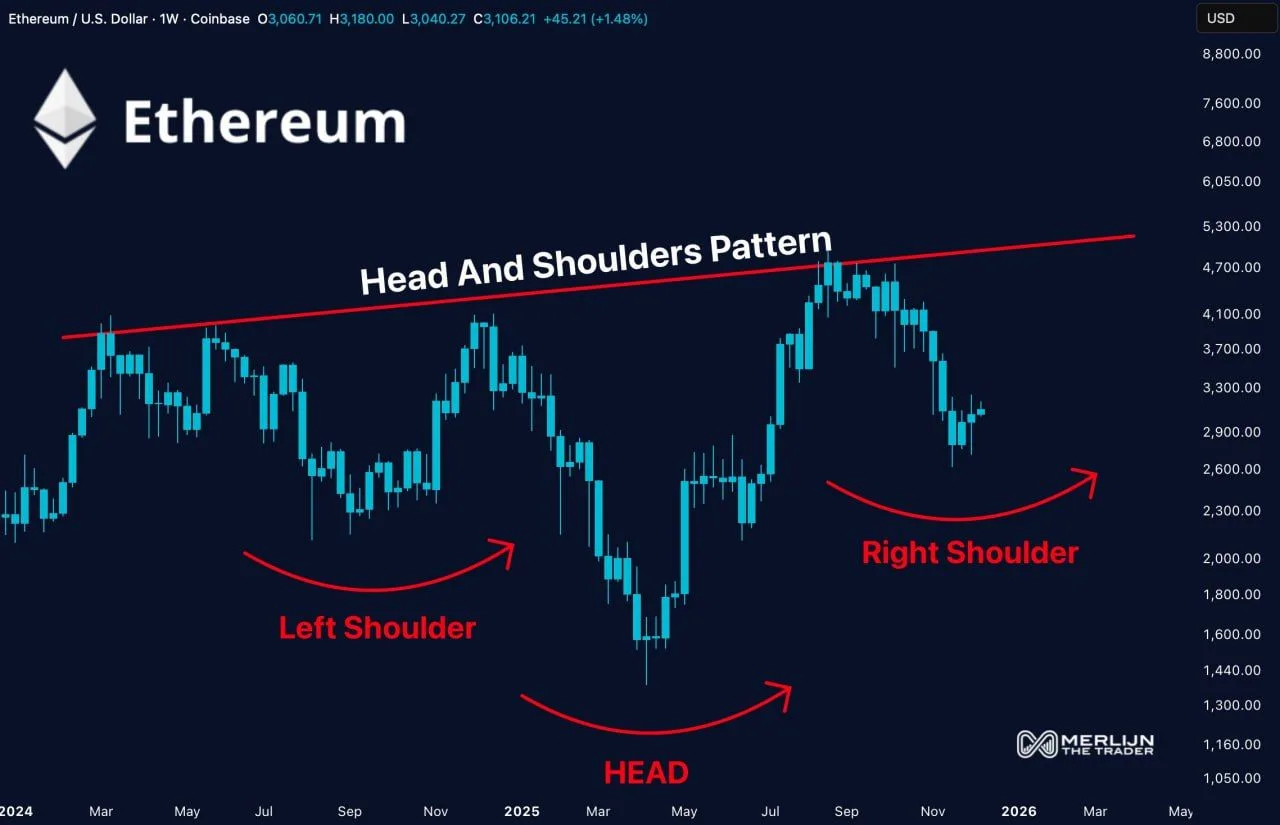
Ethereum Inverse Head And Shoulders Pattern. Source: Merlijn The Trader
In this view, the left shoulder emerged after the early 2024 rally cooled, while the head formed during the sharp drawdown that followed. The current rebound from late-2025 lows is now carving out the right shoulder, with price attempting to stabilize above prior support levels.
Merlijn describes this setup as one of the strongest bullish structures in crypto, pointing to its macro context on the higher timeframe. The pattern still requires confirmation from a clear breakout above the resistance zone, yet the chart highlights how ETH is retesting long-term levels as it builds this possible reversal base.
