
In This Article
XRP trades near $2.06 after a tough month, yet the token attracts strong institutional demand through newly launched spot XRP ETFs. The inflows reach near $1 billion in just weeks, a pace that surprises even long-time XRP watchers. The entry of major issuers and the arrival of leveraged products shape a new cycle for XRP. Traders now ask whether this institutional shift drives a sustained breakout toward the $3 region.
Massive XRP ETF Inflows Change Market Structure
Spot XRP ETFs show strong adoption from their first days of trading. Data from SoSoValue shows $12.84 million in daily net inflows on December 4. Franklin Templeton leads with $5.7 million, while Bitwise follows with $3.76 million. Daily volumes across issuers reach $28.8 million, which signals clear interest in XRP exposure.
ETF issuers change the landscape:
Canary launches the first spot XRP ETF with $59 million in day-one volume
Bitwise secures more than $105 million during its early trading days
Franklin Templeton expands its multi-asset ETF exposure by making XRP a top-tier holding
Garlinghouse comments on the ETF success, saying the inflows show real institutional trust in XRP despite past regulatory challenges. The remark sparks debate: does this shift mark the start of XRP’s institutional cycle?
ETF Variety Expands With New Approvals
21Shares secures approval for its spot XRP ETF under ticker TOXR, adding more competition. REX Shares and Tuttle Capital launch a 2x leveraged XRP ETF, which targets traders who want amplified exposure. Some traders praise the move, while others warn that leverage introduces quick reversals. The growth of product options raises a key question: Does this much ETF variety lift XRP’s long-term valuation?
CoinShares takes another route and withdraws filings for three crypto ETFs, including XRP, after rethinking its strategy. The contrast between issuers shows how competitive the ETF race becomes in 2025.
Why Institutions Turn Toward XRP
XRP trades near $2.15 despite strong ETF inflows, and that creates an interesting divergence. Institutions buy aggressively while retail investors remain cautious.
Analysts cite several drivers:
Regulated RLUSD stablecoin strengthens Ripple’s payment ecosystem
Stablecoin market projections reach as high as $2.5–$3 trillion by 2030
Cross-border settlement demand rises as banks prefer compliant assets
Liquidity depth improves as ETFs lock more than 400 million XRP
These forces raise a question: Does XRP now position itself as the most institution-ready alternative to Bitcoin and Ethereum?
Franklin Templeton’s growing interest supports that idea. Its “Easy Peasy” multi-asset ETF adds XRP among its top holdings, signaling long-term commitment from a traditional finance heavyweight.
CFTC Approval Pushes Crypto Into U.S. Regulation
A landmark ruling arrives on December 4, 2025. The CFTC confirms that spot crypto trading will list on U.S. regulated futures exchanges for the first time. This decision eliminates the uncertainty that has held the market back for years.
The CFTC ruling confirms:
Spot Bitcoin and other assets can trade on regulated venues
Retail traders can use leverage only on regulated platforms
Surveillance and custody standards match those used for futures
The era of “regulation by enforcement” ends
Agencies align through the President’s Working Group on Crypto
Bitnomial becomes the first exchange set to launch, aiming for the week of December 8. Many analysts believe this move unlocks a new phase for crypto liquidity. One comment echoed through the community: “Crypto finally enters the regulated mainstream.”
Technical View: XRP Targets Breakout Toward $3
XRP holds above $2.0657 while consolidating beneath a descending weekly trendline. Structure favors a breakout if price clears $2.2200. Momentum builds, and traders monitor volume for confirmation. A breakout targets the $3.0000 zone. If XRP stalls, support sits near $1.9800.
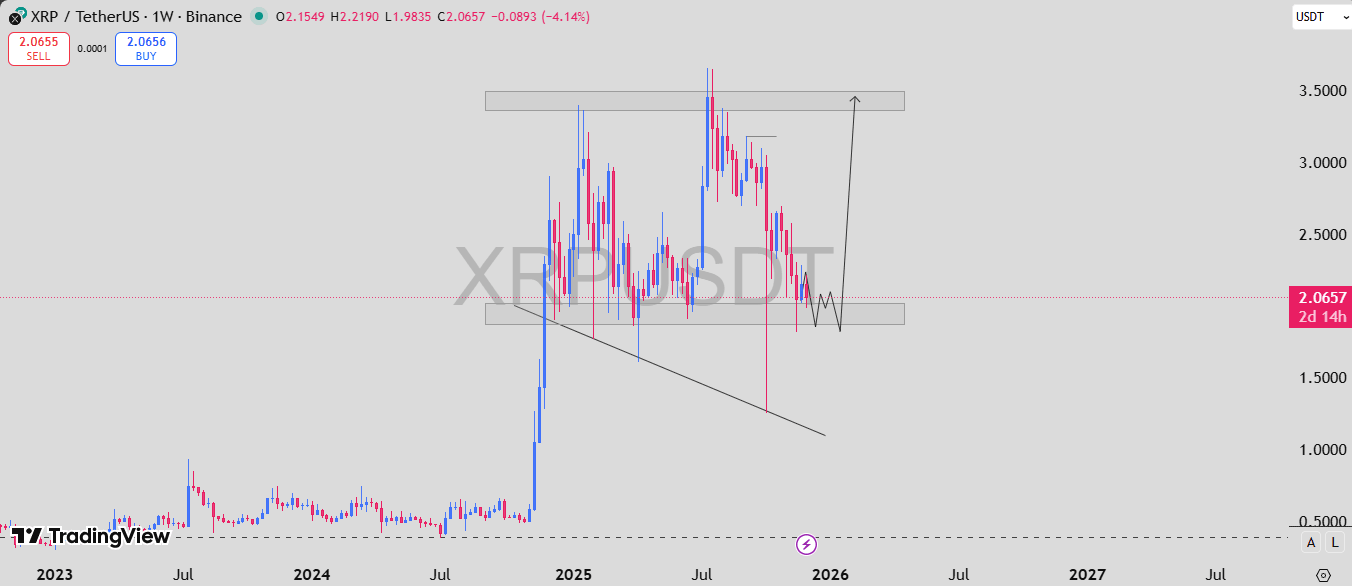
Source: X
The setup feels pivotal as XRP stands at a macro turning point, and the next impulse will define early-2026 bias.
2025 Price Prediction Table
| Month 2025 | Minimum | Average | Maximum |
|---|---|---|---|
| December | $1.75 | $2.18 | $2.60 |
XRP enters the final part of 2025 with strong institutional support. ETF flows, new regulated trading frameworks, and a bullish technical setup all shape a compelling story. The market now watches whether XRP claims the $3 level and starts a new trend phase.
