
Now MicroStrategy has dropped into the middle of a new fight over Bitcoin’s next move. As Michael Saylor talks up a “₿ig Week” and critics warn of a possible death spiral, traders are lining up MSTR charts to see which side proves right.
Saylor Signals a “Big Week” as Schiff Warns of MSTR Trouble
Bitcoin’s largest corporate holder entered the new week with rising attention after Michael Saylor shared a chart showing MicroStrategy’s Bitcoin portfolio value at $61.20 billion as of November 16.
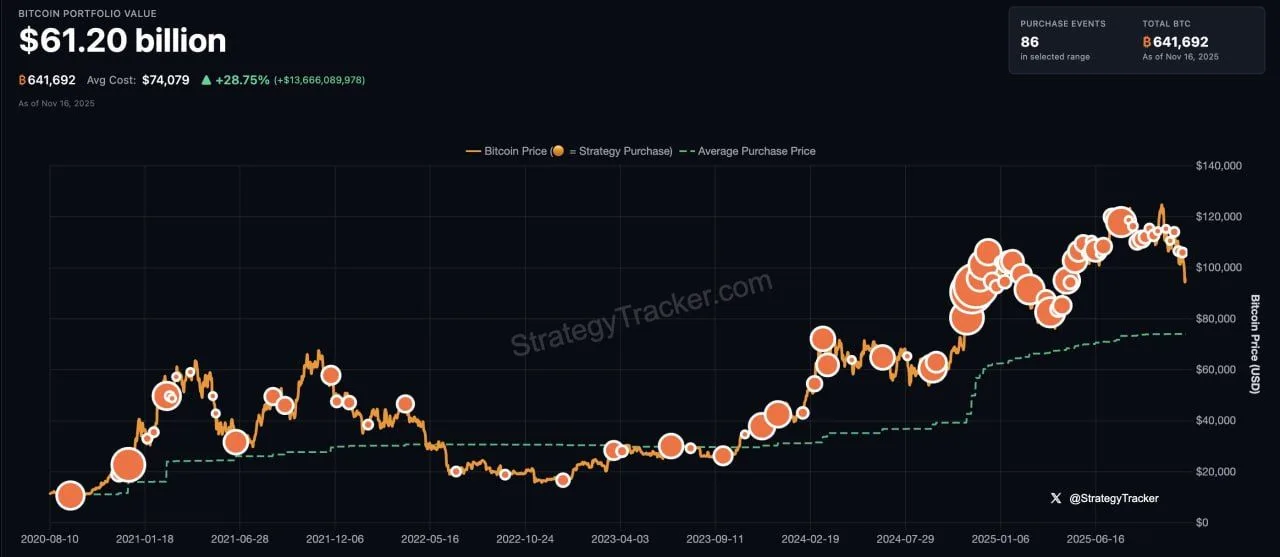
Bitcoin Portfolio Chart. Source: StrategyTracker / X
Saylor posted the update with the caption “₿ig Week,” signaling that he expects major moves for both Bitcoin and MicroStrategy as volatility returns. His message came while Bitcoin trades below recent highs and MSTR mirrors the pullback.
At the same time, veteran gold advocate Peter Schiff challenged Saylor’s optimism. He said Bitcoin and MicroStrategy face “big losses” this week, arguing that MicroStrategy’s business model depends on income-oriented funds buying its high-yield preferred shares. According to Schiff, those yields “will never actually be paid,” and once managers recognize the risk, they will exit their positions, making it harder for the company to issue additional preferred shares.
Schiff added that such a shift could trigger what he called a “death spiral” for MicroStrategy, intensifying the disagreement between the two long-time critics of each other’s market views.
MicroStrategy Slides Into Key Support Zone as Trader Sets “Top Watch”
MicroStrategy stock is back on traders’ radar after a sharp decline that erased more than half of its value from the recent peak. On the weekly chart shared by BRITT (@BullishBritt), MSTR has dropped into a wide price band around 190–200 dollars that previously acted as a major supply zone during 2024. The new test comes after weeks of heavy selling that pushed the stock straight down from above 360 dollars.
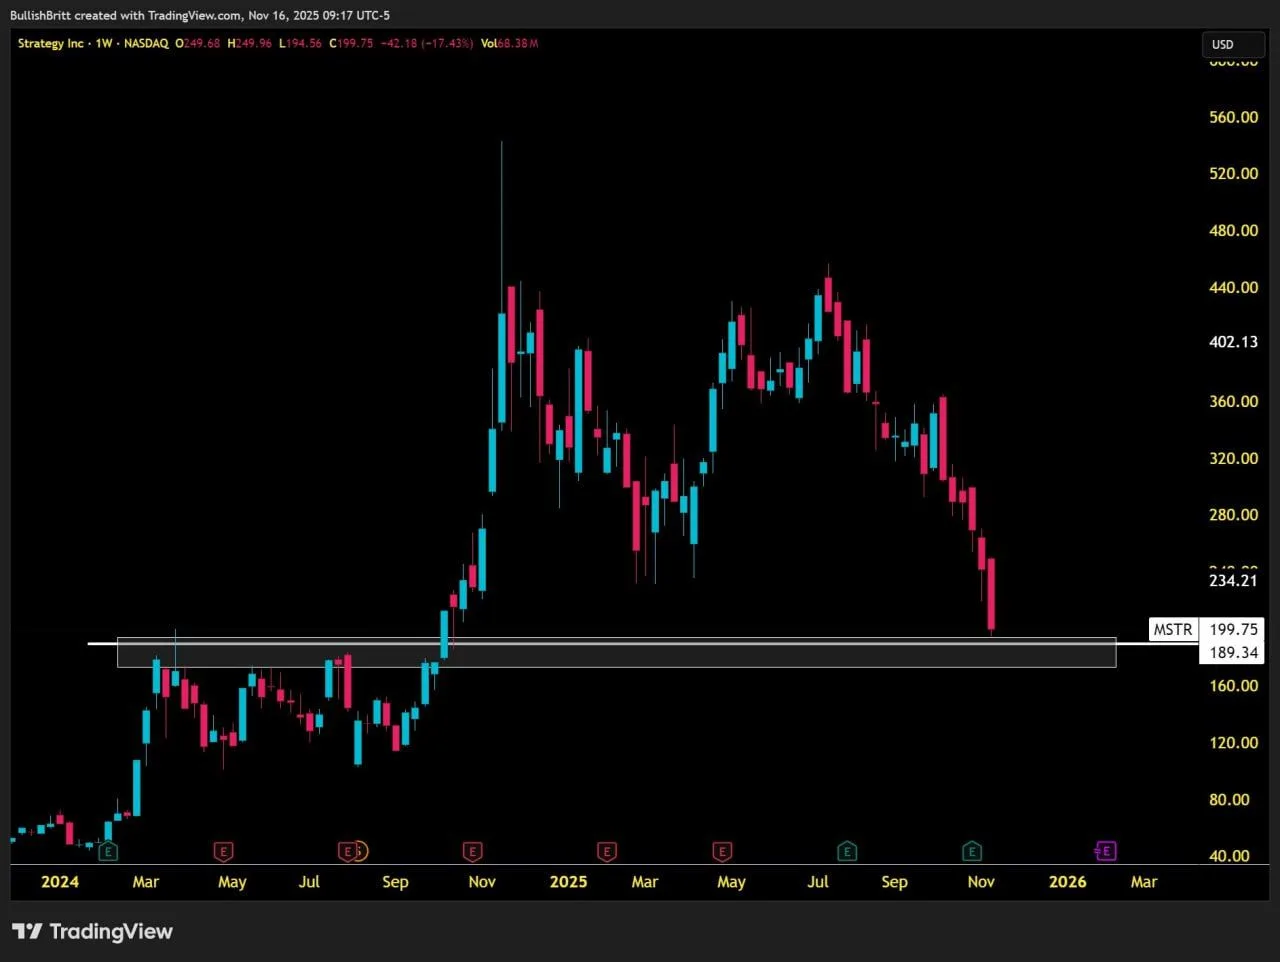
MicroStrategy MSTR Weekly Support Zone. Source: BullishBritt on X
Now BRITT describes MSTR as her “top watch” for the week, saying she expects the former supply area to act as support and form a demand zone on this retest. In her view, the highlighted region marks a level where the stock paused and reversed multiple times in the past, which could attract fresh buyers if the zone holds. The chart shows price pressing into that band with elevated weekly volume, underscoring how much trading activity is clustering around the level.
At the same time, BRITT says she is looking for a “relief bounce” from the support area, with a possible move back toward the 250–280 dollar range if the reaction unfolds. She frames the setup as a short-term recovery play after an extended drawdown, while the broader trend for both MSTR and Bitcoin remains under scrutiny.
TrendSpider Flags Cup-Shaped Recovery as MSTR Retests Overhead Zone
Meanwhile, TrendSpider highlighted a different angle on MicroStrategy’s price action, posting a chart with the caption, “Don’t show this chart to Michael Saylor.” The daily setup shows MSTR carving out a large cup-shaped recovery from its mid-year lows, with price now pushing back into the same overhead zone that capped rallies earlier in 2025.
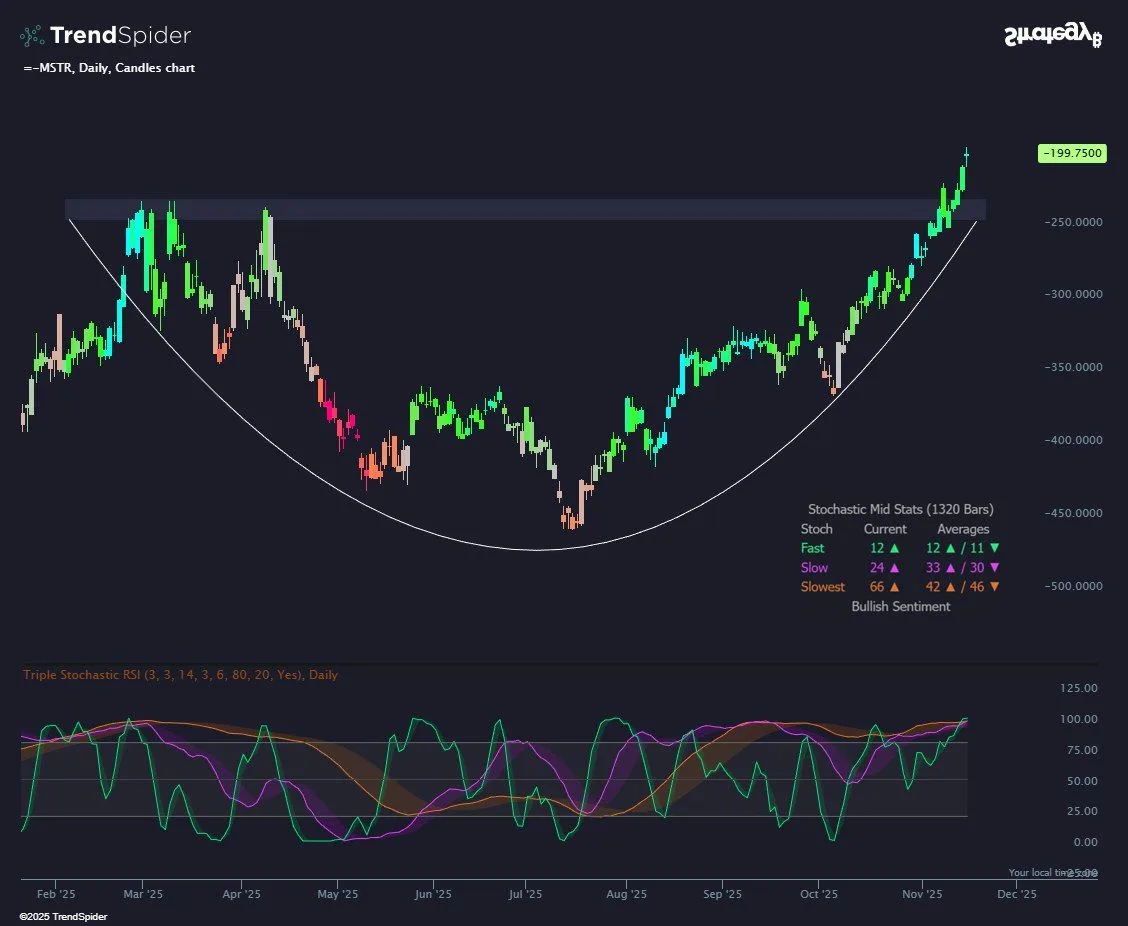
Cup-Shaped MSTR Daily Chart. Source: TrendSpider
Now the chart outlines a smooth rounded base that spans several months, showing a transition from heavy selling to steady accumulation. As the rebound accelerates, MSTR is trading just under the shaded resistance band near 199.75 dollars, an area that rejected multiple attempts in the past. The move adds fresh attention to whether the stock can break above the ceiling after forming such a deep recovery structure.
At the same time, the lower panel shows a triple stochastic RSI clustering in higher ranges, reflecting bullish momentum as the chart presses into resistance. TrendSpider frames the setup as a moment where sentiment is improving, but the stock still must clear one of its most persistent technical barriers.
