
PEPE is drawing fresh attention as a GameFi project adds it to in-game rewards and analysts spot bullish signals on its daily chart. As the memecoin trades near a long-term support zone, these developments are shaping expectations for its next move.
Pepenode highlights PEPE as in-game reward token
PEPE gained fresh utility this week after GameFi project Pepenode promoted the meme coin as one of its core in-game rewards. The update appeared in a new post on X showing a PEPE character building a wooden walkway, paired with a message that players can “buy meme nodes, upgrade facilities and earn meme coins” on one platform.
Pepenode Mine to Earn Illustration. Source: Pepenode on X
Pepenode said its browser-based “mine to earn” game lets users build virtual mining rigs, expand efficiency and collect rewards across several meme assets. The project emphasized that PEPE is included in its reward pool, placing the token inside a broader engagement system rather than tying it to a single marketing event.
Earlier project materials also noted that Pepenode’s presale and staking design featured bonus distributions in multiple meme coins, including PEPE. The inclusion keeps PEPE active inside the game’s ecosystem and extends its presence beyond standard trading activity.
Analysts flag bullish divergence on PEPE charts
Meanwhile, PEPE watchers on X are pointing to a familiar technical pattern as the memecoin trades near a long-term support zone. Trader ray (@moonbag) shared a daily PEPE/USDT chart that shows price repeatedly bouncing from a horizontal area that has acted as support since early 2024. He boxed the zone on the chart and called the current retest “an absolute opportunity to buy,” adding that he is already long PEPE at these levels.
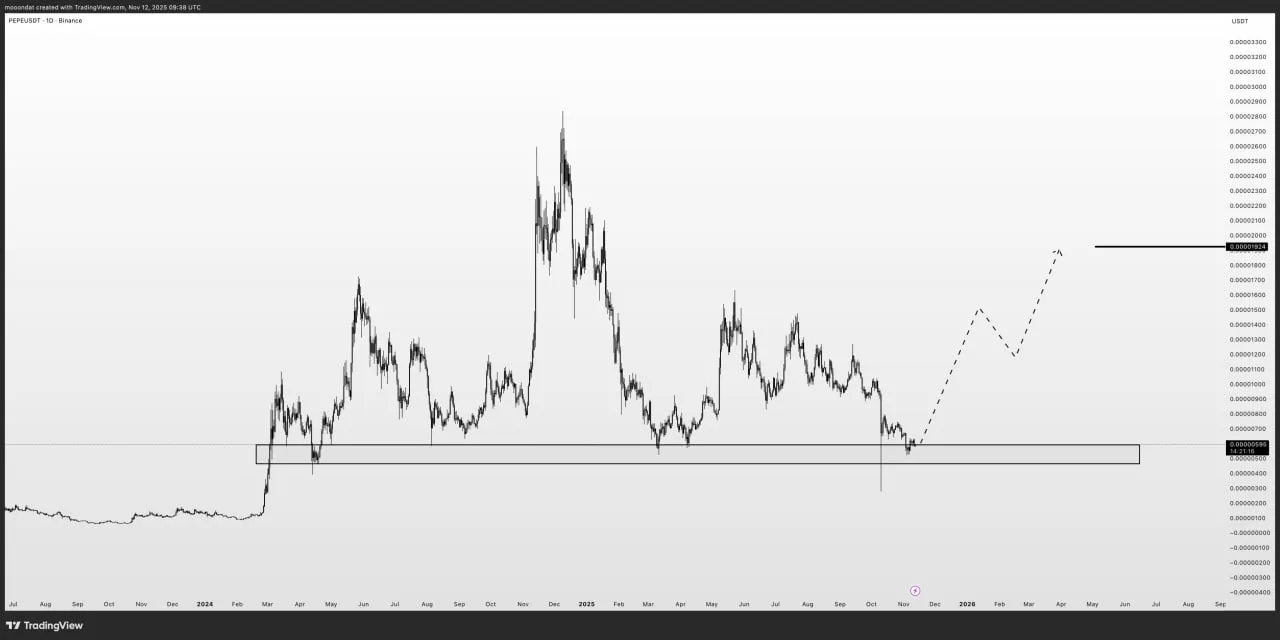
PEPE Long-Term Support Zone. Source: ray on X
Ray’s chart highlights how previous dips into the same region have been followed by sharp rebounds, with long lower wicks marking aggressive buying each time price entered the box. By framing the area as a demand zone, he argues that the market has a history of absorbing sell pressure there, even after deep pullbacks.
At the same time, Chandler (@ChandlerCharts) posted a separate daily chart that marks repeated instances of bullish divergence between PEPE’s price and the relative strength index. In his view, each prior divergence preceded strong upside swings, and the latest pattern again shows RSI rising while price stabilizes.
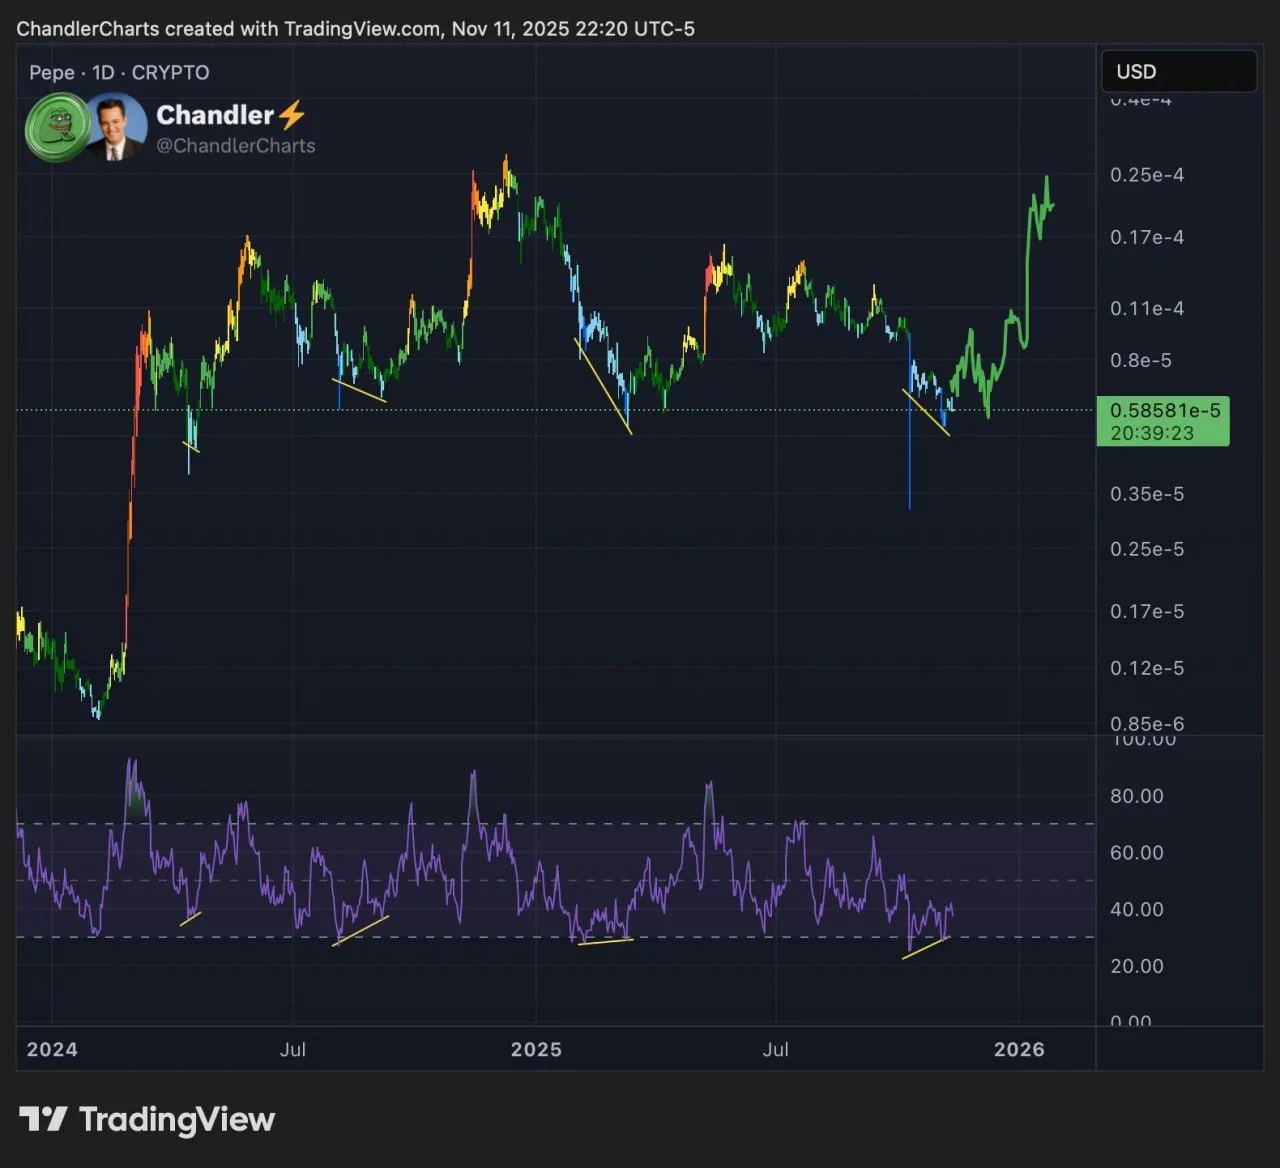
PEPE Daily Bullish Divergence. Source: ChandlerCharts on X
Together, the two charts frame PEPE’s current pullback as a potential inflection point, with the analysts pointing to historical reactions from similar conditions as a guide for their outlook.
