
Dogecoin is attempting to regain stability after a sharp market shakeout that tested traders’ confidence. The popular meme coin has found crucial support near the $0.16 mark, with technical indicators showing signs of resilience. The latest rebound could mark a defining moment for the asset’s short-term trajectory. Whether the recovery continues now depends on reclaiming a specific resistance zone that may unlock further upside potential.
Weekly 200-EMA Bounce Marks Key Defense Zone
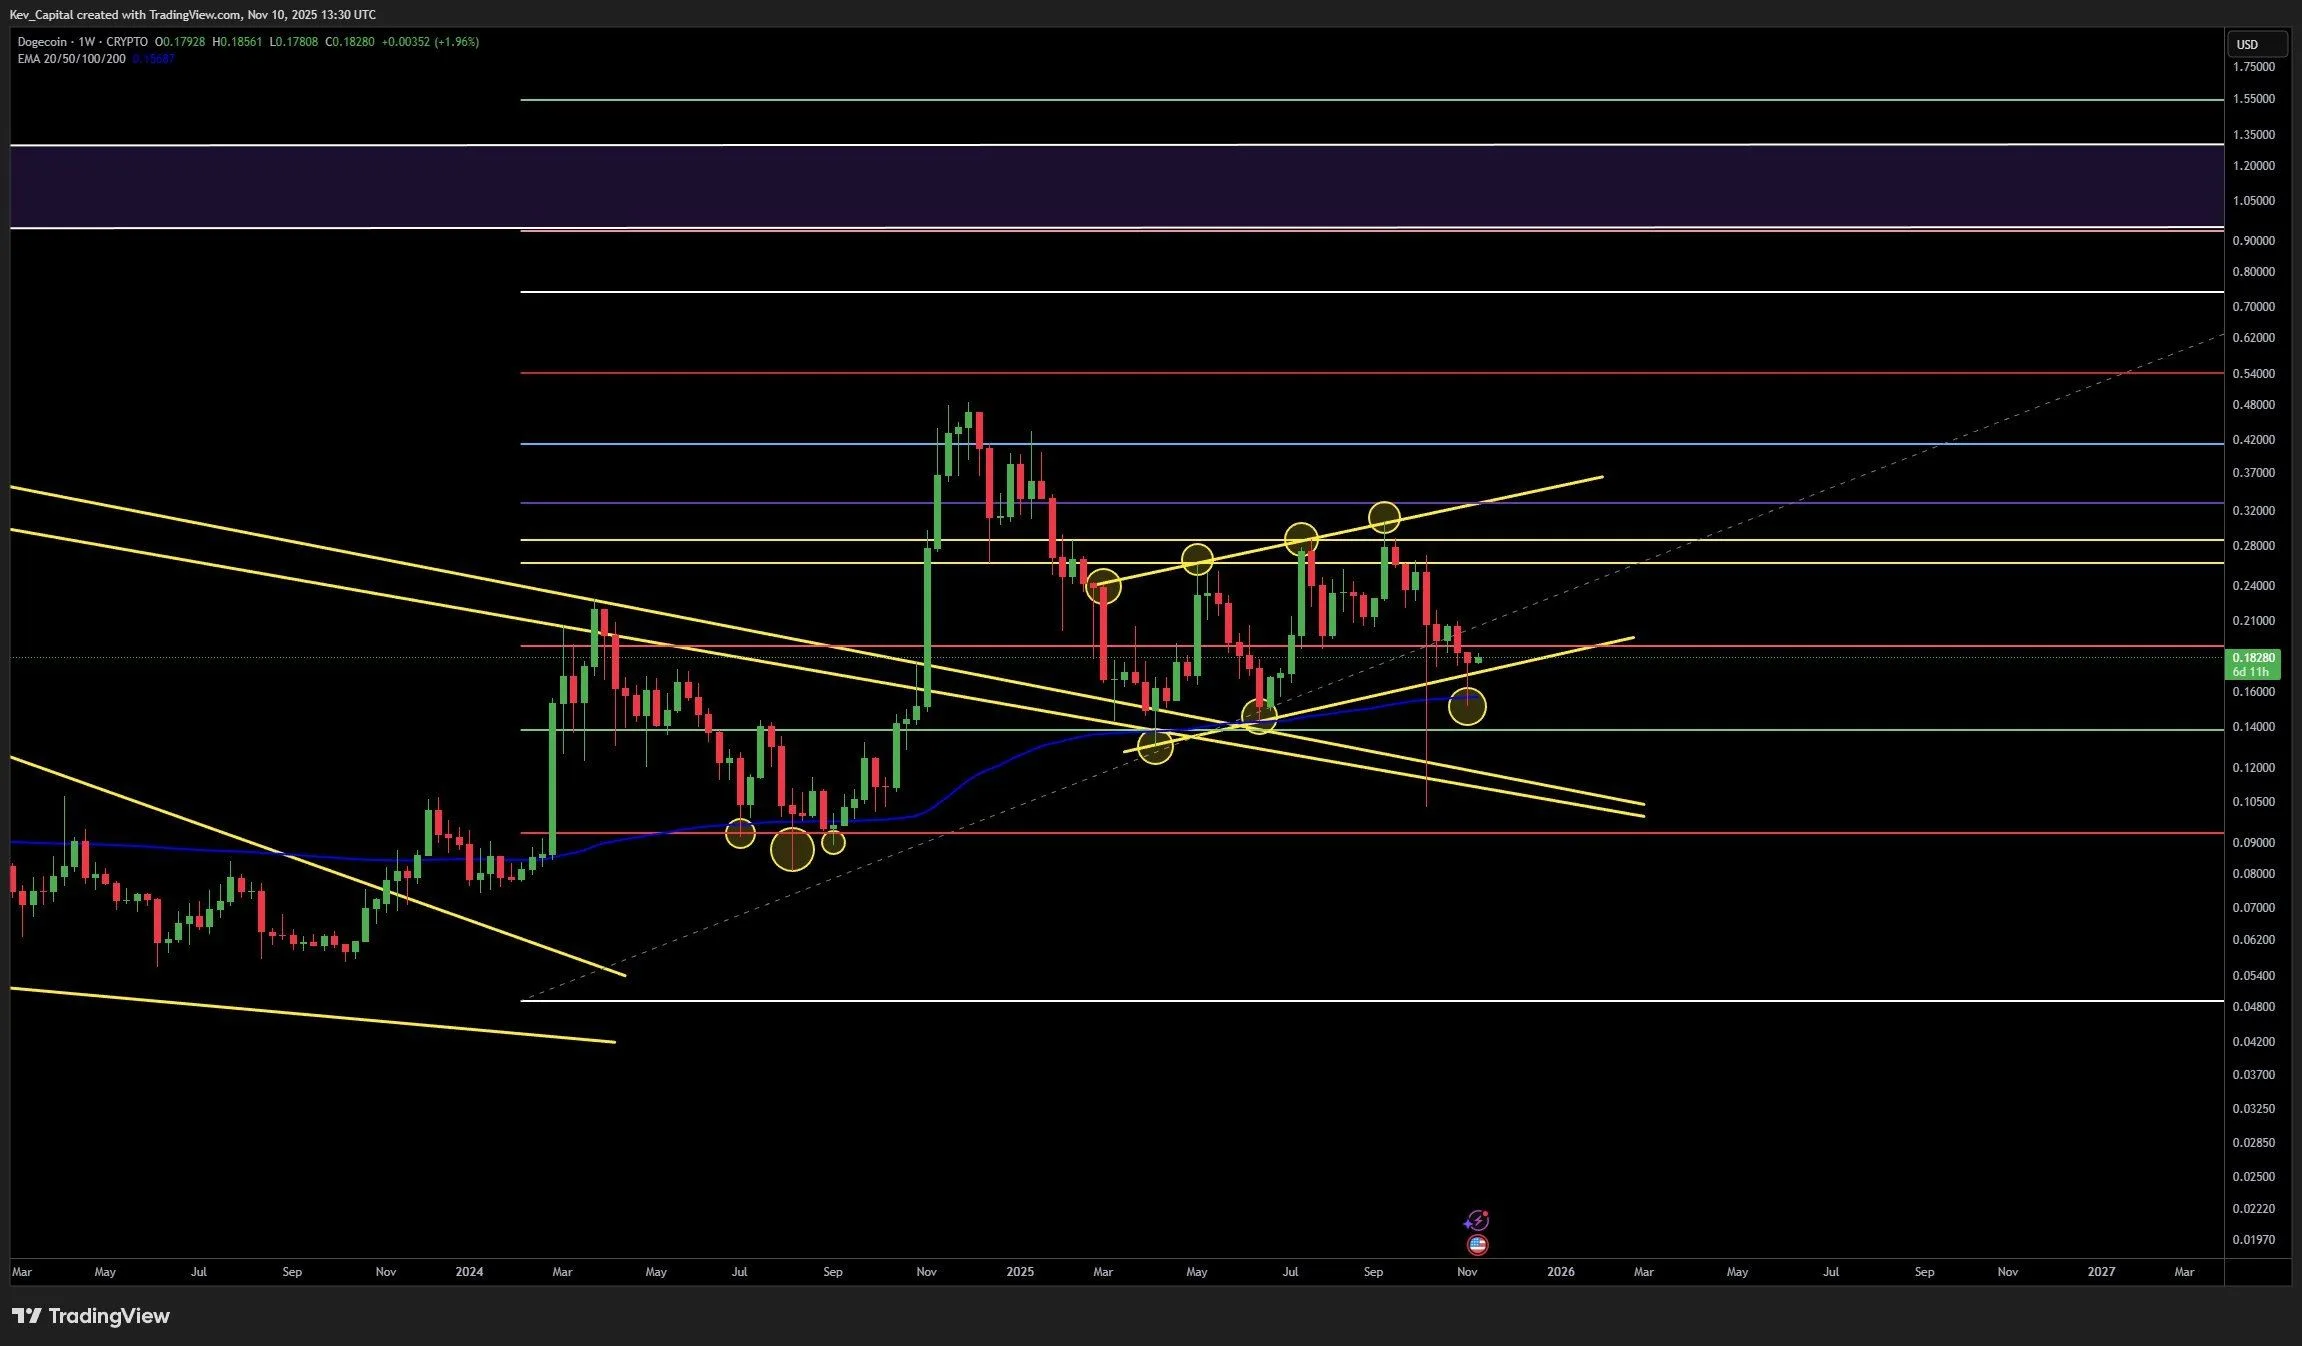
Market analyst Kevin (@Kev_Capital_TA) highlighted on X that Dogecoin staged a “solid bounce” from its weekly 200-exponential moving average (EMA), a level he considers the market’s “line in the sand.” On his weekly chart, DOGE rebounded off the $0.16 handle, pushing back into its dominant yearly trading range around $0.1828. He noted that this 200-week EMA has preserved the coin’s bullish structure six separate times since last summer, maintaining a rising slope that continues to support the broader trend.
Source: X
His framework focuses on specific technical levels rather than broader market sentiment. Kevin identified $0.202 as the pivotal level on a three-day closing basis. A close above that threshold, he explained, would place Dogecoin back over the macro 0.5 Fibonacci retracement and above the three-day 200 EMA/SMA.
The chart further shows that the weekly bounce defended both the lower rail of Dogecoin’s upward-tilting channel and the 200-week average. This channel, defined by two yellow boundary lines, has guided DOGE’s structure throughout the year, marking clear support and resistance zones. Each touch of the channel lines has validated the trend, with the latest long downside wick signaling strong buyer interest near $0.16.
As of this writing, Dogecoin was trading at around $0.17737, with a 24-hour loss of 2.1%.
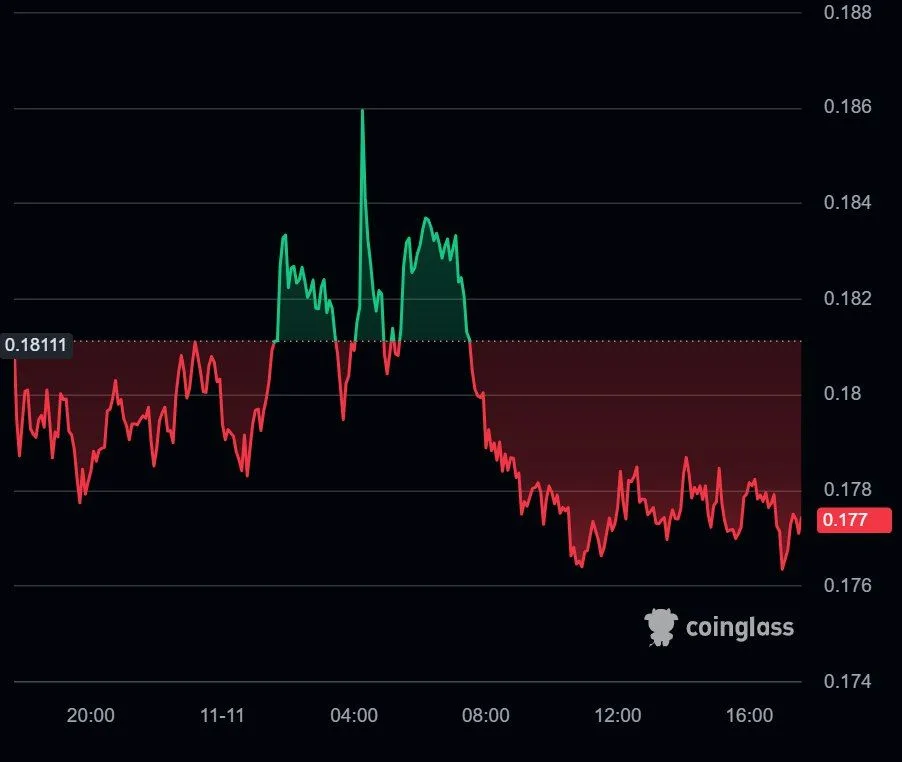
Source: Coinglass
Critical Levels Define DOGE’s Near-Term Roadmap
Kevin’s technical outlook outlines a clear roadmap for both upside and downside scenarios. Above the $0.202 reclaim, Dogecoin faces clustered resistance levels at $0.24, $0.26, $0.285, and $0.305, each corresponding to prior weekly turning points. These zones also align with repeated upper-channel touches recorded during the summer and early autumn, where sellers previously took control.
On the downside, the analyst noted a sequence of backstops if the current bounce were to fade. A green horizontal support lies near $0.14, with deeper weekly shelves around $0.09 and $0.05. These supports are reinforced by remnants of a broader down-sloping trendline that now tracks just below the recent wick. Kevin observed that these intersecting lines likely explain the aggressive buying pressure during the recent market flush.
Higher-timeframe Fibonacci extensions remain plotted for context, with potential resistance levels seen at $0.42, $0.54, and $0.74. However, the focus remains on the immediate test of $0.202. “Solid bounce for Dogecoin off of the weekly 200 EMA back into our weekly range,” he wrote on X, adding that reclaiming the $0.202 level “on three-day closes” could create some upward momentum.”
