
SHIB is trading at around $0.00001292, suggesting a 0.11% increase in the last 24 hours, with resistance near $0.00001358 and support forming around $0.0000129. After holding steady in the early hours, SHIB faced consistent selling pressure, pushing the price downward.
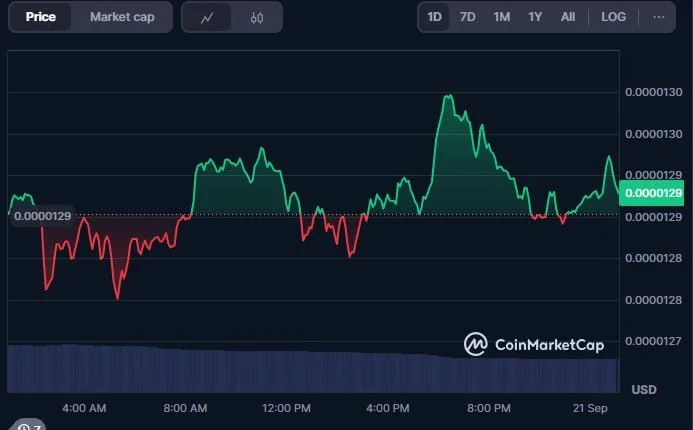
Source: Coinmarketcap
Shiba Inu (SHIB) is drawing renewed attention after popular community member Heber Mayen suggested the token is preparing for an explosive breakout. In a recent post, Mayen highlighted that Shiba Inu’s one-month price chart is showing a 3.65% gain over the past 30 days to $0.00001345.
The asset has been consolidating within a descending triangle pattern, which has historically signaled major price movements once the pattern reaches its end.
According to Mayen’s analysis, Shiba Inu is nearing the extreme low point of its triangle structure. This technical setup suggests a decisive move is imminent. He expressed confidence in a bullish breakout, supported by strong momentum indicators
Is Shiba Inu ATH Incoming?
Community analyst Shib Spain also echoed a bullish stance. He suggested Shiba Inu is consolidating within the $0.00001270 to $0.00001347 support range. He anticipates a rebound from this level, which could provide the base for a strong uptrend. If sustained, this momentum might help Shiba Inu challenge previous price barriers.
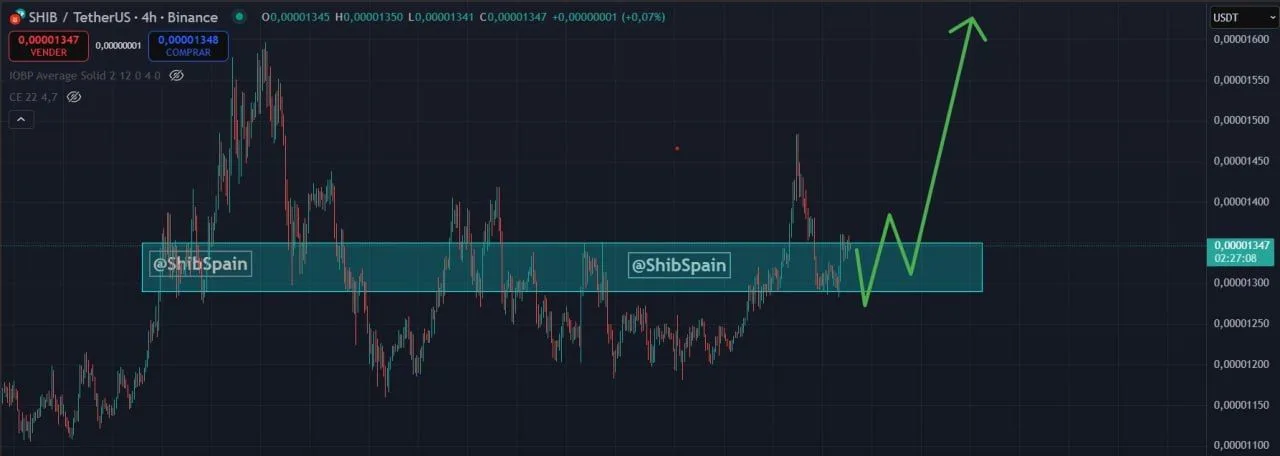
Source: X
While Mayen refrained from setting a specific price target or timeline, Shib Spain went further in his outlook. To achieve this, Shiba Inu would need to surge by 568% from its current level to surpass its October 2021 peak of $0.00008845. Such a move would mark a significant recovery and reaffirm SHIB’s potential as a high-volatility meme token capable of rapid rallies under favorable market conditions.
SHIB Consolidates as Indicators Show Neutral Momentum
The daily SHIB shows that price action has entered a period of consolidation after a recent upward move. Price candles reveal that SHIB has been fluctuating between approximately $0.00001250 and $0.00001360 over the last sessions, repeatedly failing to break above the $0.00001400 resistance.
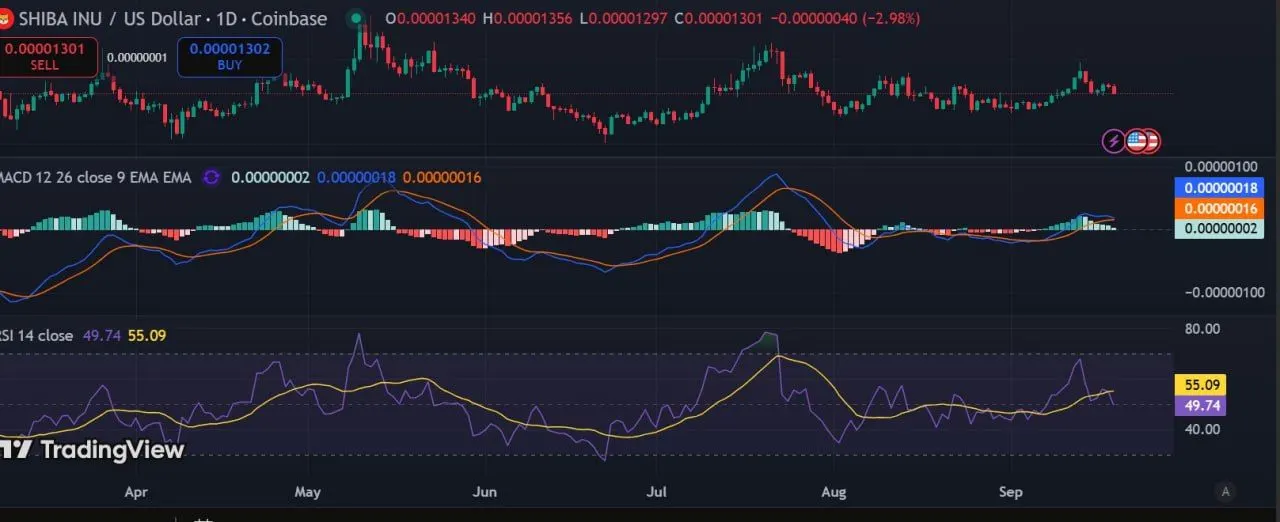
SHIB/USD price chart, Source: TradingView
The MACD is showing a bullish signal, as the blue MACD line has crossed above the orange signal line, supported by rising green histogram bars that reflect strengthening upward momentum. This suggests that buyers are regaining control and could push the price higher in the short term. The RSI is at 49.85, which means SHIB is neither overbought nor oversold, reinforcing the picture of a consolidating market.
