
Bitcoin is still trading like a market trying to find its bottom, with analysts watching whether BTC first sweeps the $58,000 liquidity zone before recovering. If buyers step in there, the next move could be a rebound toward $62,400-$63,200, with $68,500 still the bigger level bulls need to reclaim.
Bitcoin Chart Mirrors Previous Bear Market Bottom Setup
Bitcoin is trading near $59,700 as one analyst says BTC is still following a structure similar to its previous bear market bottom formation.
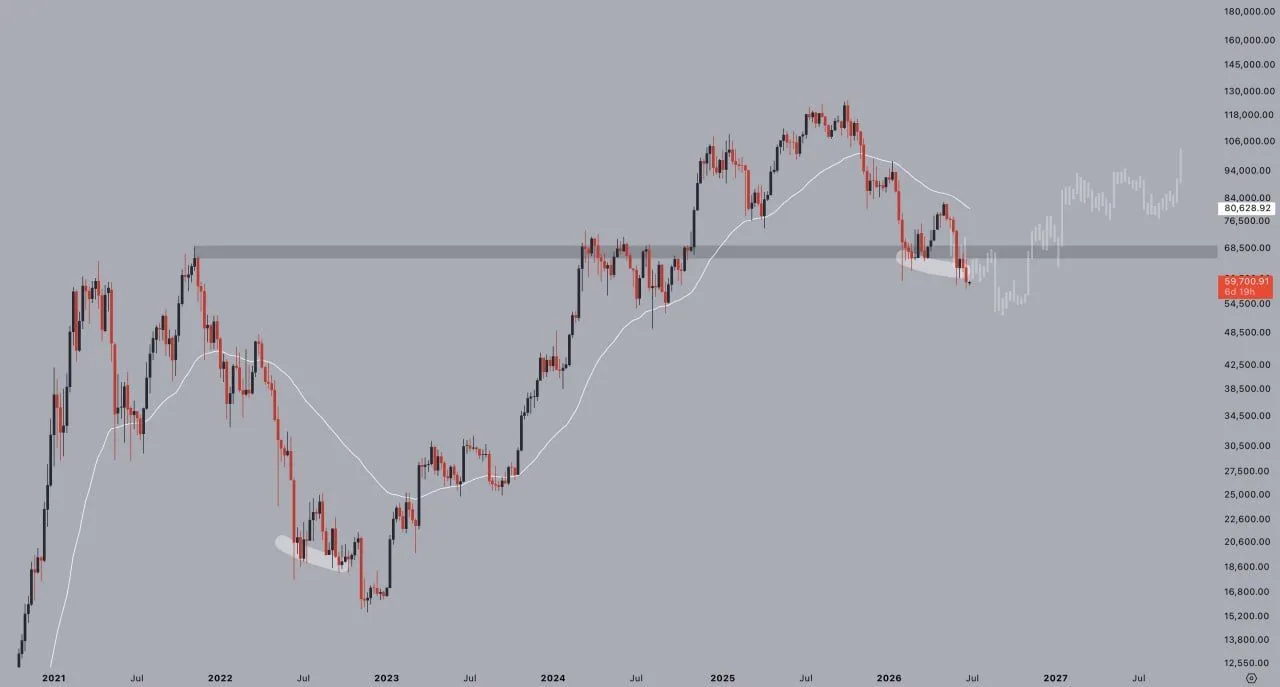
BTC/USD weekly chart. Source: Jelle on X, TradingView
The chart compares Bitcoin’s current pullback with the bottoming structure seen during the last bear market. In both cases, BTC dropped sharply from a major high, moved into a key support area and began forming a possible base before recovery.
The main level on the chart sits around the $68,500 area. Bitcoin recently lost that zone and is now trading below it, which makes the level important resistance if price tries to recover.
The projected path shows BTC could still move through more sideways volatility before a stronger rebound develops. That would match the earlier bottoming pattern, where Bitcoin did not recover in a straight line.
However, the setup still depends on buyers defending the current range. A deeper move below the recent lows would weaken the comparison and suggest the market needs more time before forming a durable bottom.
For now, the chart points to a familiar but fragile setup. Bitcoin may be building another long-term base, but reclaiming the $68,500 area would be the key step toward confirming stronger momentum.
Bitcoin Chart Points to Possible Sweep of $58K Before Rebound
Bitcoin is trading near $59,700 as one analyst says BTC could first sweep liquidity near $58,000 before attempting a move back toward higher resistance levels.
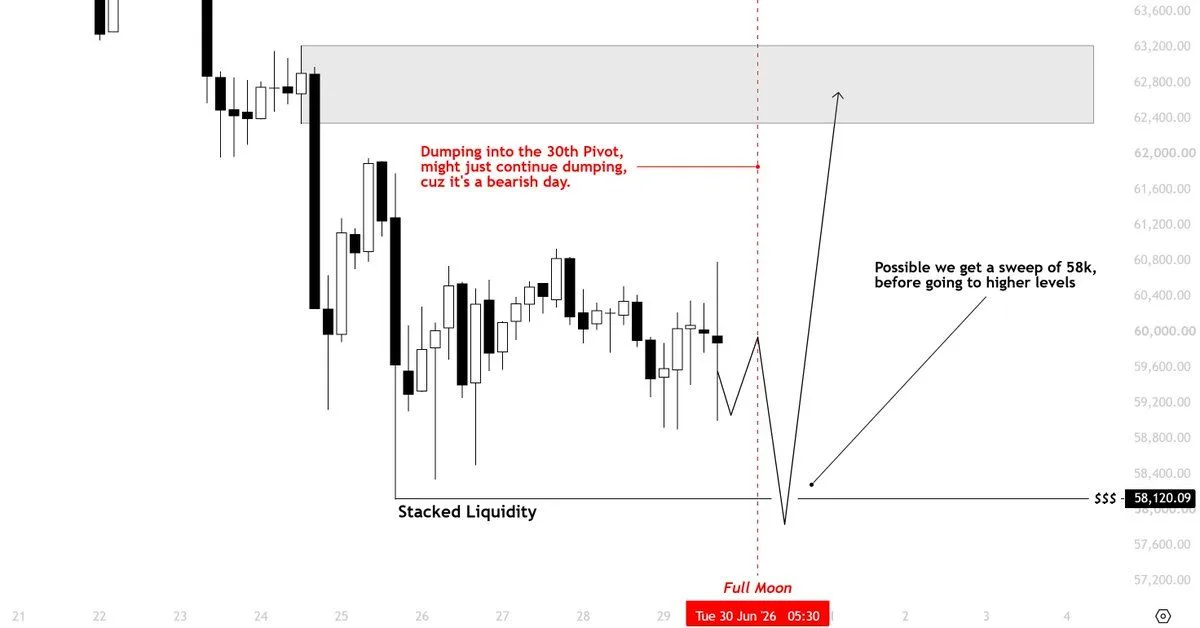
BTC price action chart. Source: Kaz on X
The chart shows Bitcoin moving sideways after several days of choppy price action. According to Kaz, that structure may have built stacked liquidity below the current range, making the $58,000 area an important downside level to watch.
The analyst says BTC could dip toward that zone first, clear the liquidity and then reverse higher. The projected path on the chart shows a possible move below $58,120 before a stronger bounce toward the $62,400-$63,200 resistance area.
For now, the setup remains short-term bearish unless Bitcoin reclaims higher levels. The chart also notes that June 30 could remain a volatile pivot day, with price still at risk of another move lower before buyers step in.
However, the broader plan does not turn fully bearish. Kaz says July has historically been a green month for Bitcoin and expects that trend to continue unless price action proves otherwise.
The key level now is $58,000. A sweep and strong reaction from that area could support a rebound, while a clean breakdown below it would weaken the bullish recovery setup.
