
In the dynamic and often turbulent realm of cryptocurrencies, where fortunes can shift overnight and trends change in the blink of an eye, a standout player is making waves for all the right reasons. Polygon (MATIC), the Layer 2 scaling solution woven into Ethereum's fabric, has taken the market by storm with a dramatic surge in whale transactions.
In a remarkable display of resilience, Polygon has managed to command attention and appreciation even amidst price volatility, showcasing not only its technological prowess but also its unyielding magnetism for both investors and enthusiasts. Meanwhile, a bullish falling wedge pattern had formed on MATIC’s daily chart, suggesting that a bullish breakout may soon occur.
Whale Activity on Polygon Spikes
Polygon (MATIC), a well-known Layer 2 scaling solution on the Ethereum network, has demonstrated remarkable resilience and growth despite recent price fluctuations.
Over the past week, Polygon has caught the attention of cryptocurrency enthusiasts and investors alike by showcasing a significant increase in its total whale transactions.
Whale transactions, defined as transactions involving $100,000 or more worth of MATIC, have soared by an astonishing 49.44%, as reported by the cryptocurrency analytics platform IntoTheBlock. This surge in whale activity reflects the underlying strength and appeal of the protocol, irrespective of the current price action.
A mere week ago, there were 34 whale transactions involving MATIC. However, this number skyrocketed to a high of 116 transactions before slightly receding to 60 yesterday. This remarkable growth in whale transactions is even more impressive considering the relatively subdued price movement of MATIC during the same period.
What sets Polygon apart is not just its price resilience, but also the tenacity displayed by its key stakeholders. The surge in whale transactions signifies the commitment of major players within the ecosystem to uphold the integrity and potential of Polygon's Layer 2 scaling solution. This commitment becomes all the more evident when considering the backdrop of relatively stagnant price movements.
Polygon's reputation as a prominent Layer 2 protocol has been further solidified with the introduction of its zkEVM outlet. This innovation enhances Polygon's position as a next-generation smart contract hub, catering to the demands of decentralized applications (dApps) and the broader DeFi (Decentralized Finance) ecosystem. With a slate of new dApps expected to launch in the near future, Polygon's usability is poised to flourish, driving both short-term and long-term adoption of the project’s native token MATIC.
Moreover, Polygon enjoys substantial institutional support, laying a solid foundation for its long-term growth prospects. While current market conditions may not be fully conducive to realizing its potential, the protocol's fundamentals and institutional backing provide a compelling case for sustained growth over time.
MATIC Escapes the overall market trend
At press time, CoinMarketCap indicated that MATIC was changing hands at $0.5539 after it achieved a 2.20% gain over the past 24 hours. Notably, the altcoin’s price rose during a period that saw the total cryptocurrency market cap drop by 0.23% - bringing the market’s total valuation down to around $1.05 trillion.
Furthermore, the trading volume for MATIC experienced a 16+% increase, reaching a substantial $335 million. This upward trajectory in trading volume suggests a strong market interest in the cryptocurrency.
Technical Overview
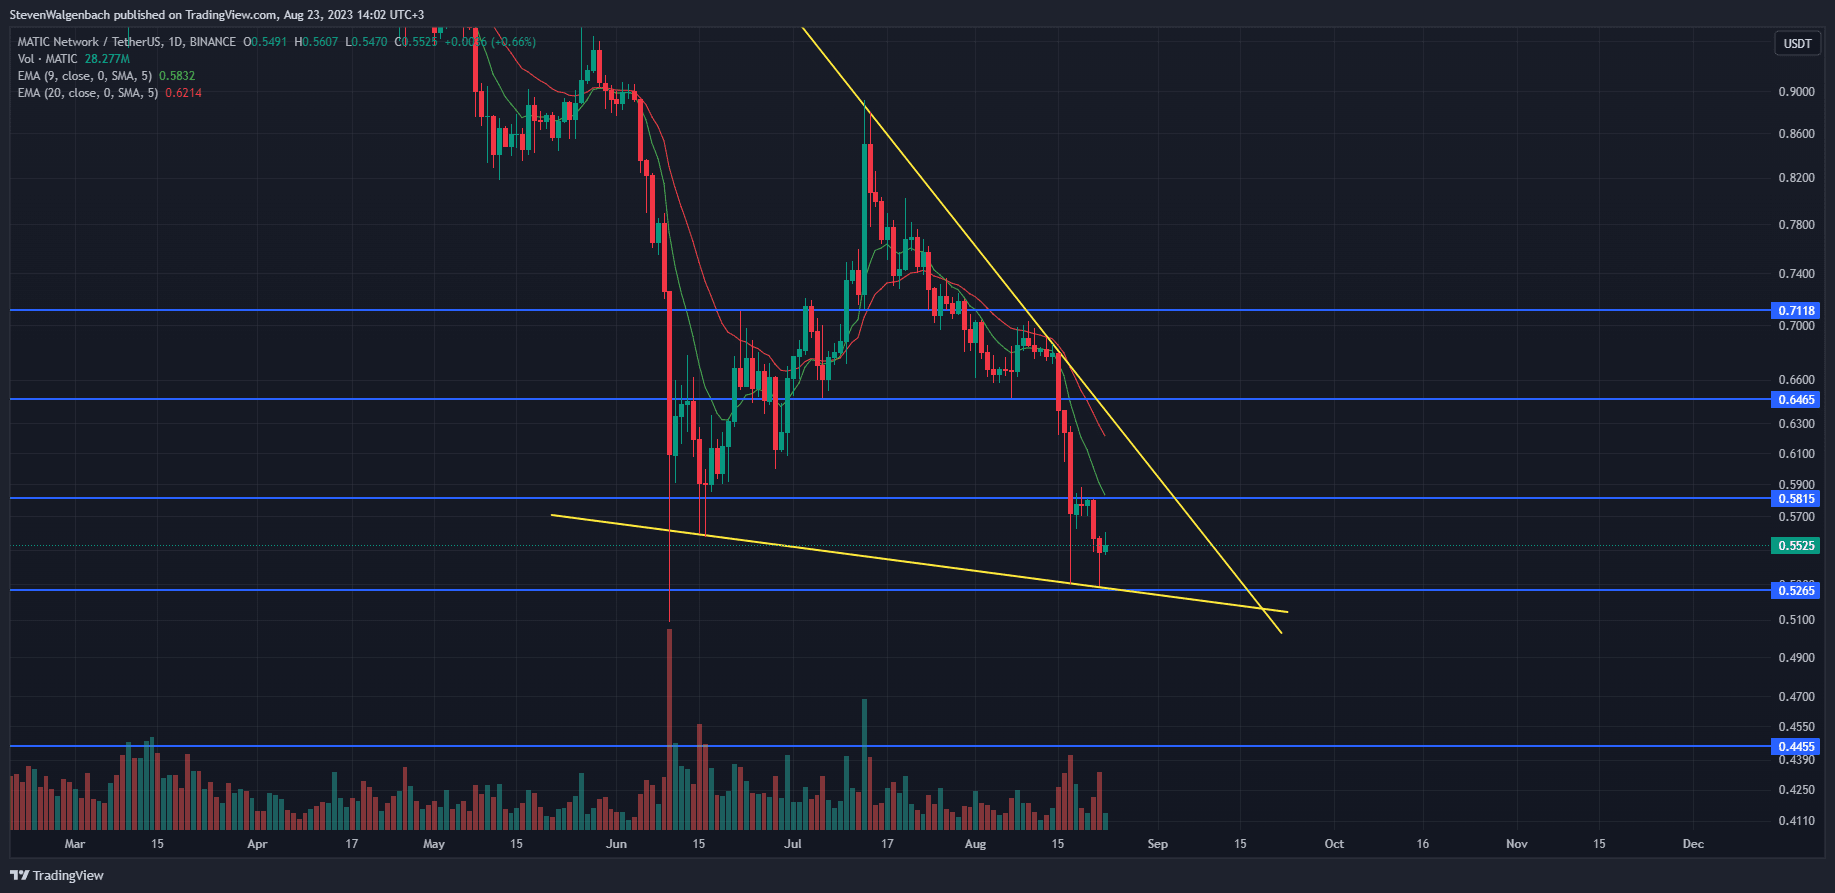
Daily chart for MATIC/USDT (Source: TradingView)
From a technical perspective, a bullish breakout may be in the cards for MATIC in the coming 2 weeks given the fact that a falling wedge chart pattern had formed on the altcoin’s daily chart. If validated, the cryptocurrency’s price could potentially rise to $0.7118 within the next month.
An early confirmation of this bullish thesis will be when MATIC closes a daily candle above $0.5815. In this scenario, the altcoin’s price will also reclaim the support of the 9-day EMA line. Thereafter, MATIC’s price will have a fairly clear path on its journey towards the next resistance level at $0.6465. If it is able to break above the 20-day EMA line, then MATIC will most likely have the buy support needed to flip the $0.6465 resistance level into support in the following few days.
If traders do not take profit once MATIC’s price breaches the $0.6465 threshold, then the positive movement may lead to the cryptocurrency’s price rising to as high as $0.7118. This bullish thesis will be invalidated if MATIC breaks below the closest support level at $0.5265 within the next week. Should MATIC close 2 consecutive daily candles below this mark it will be at risk of testing the next significant level at $0.4455.
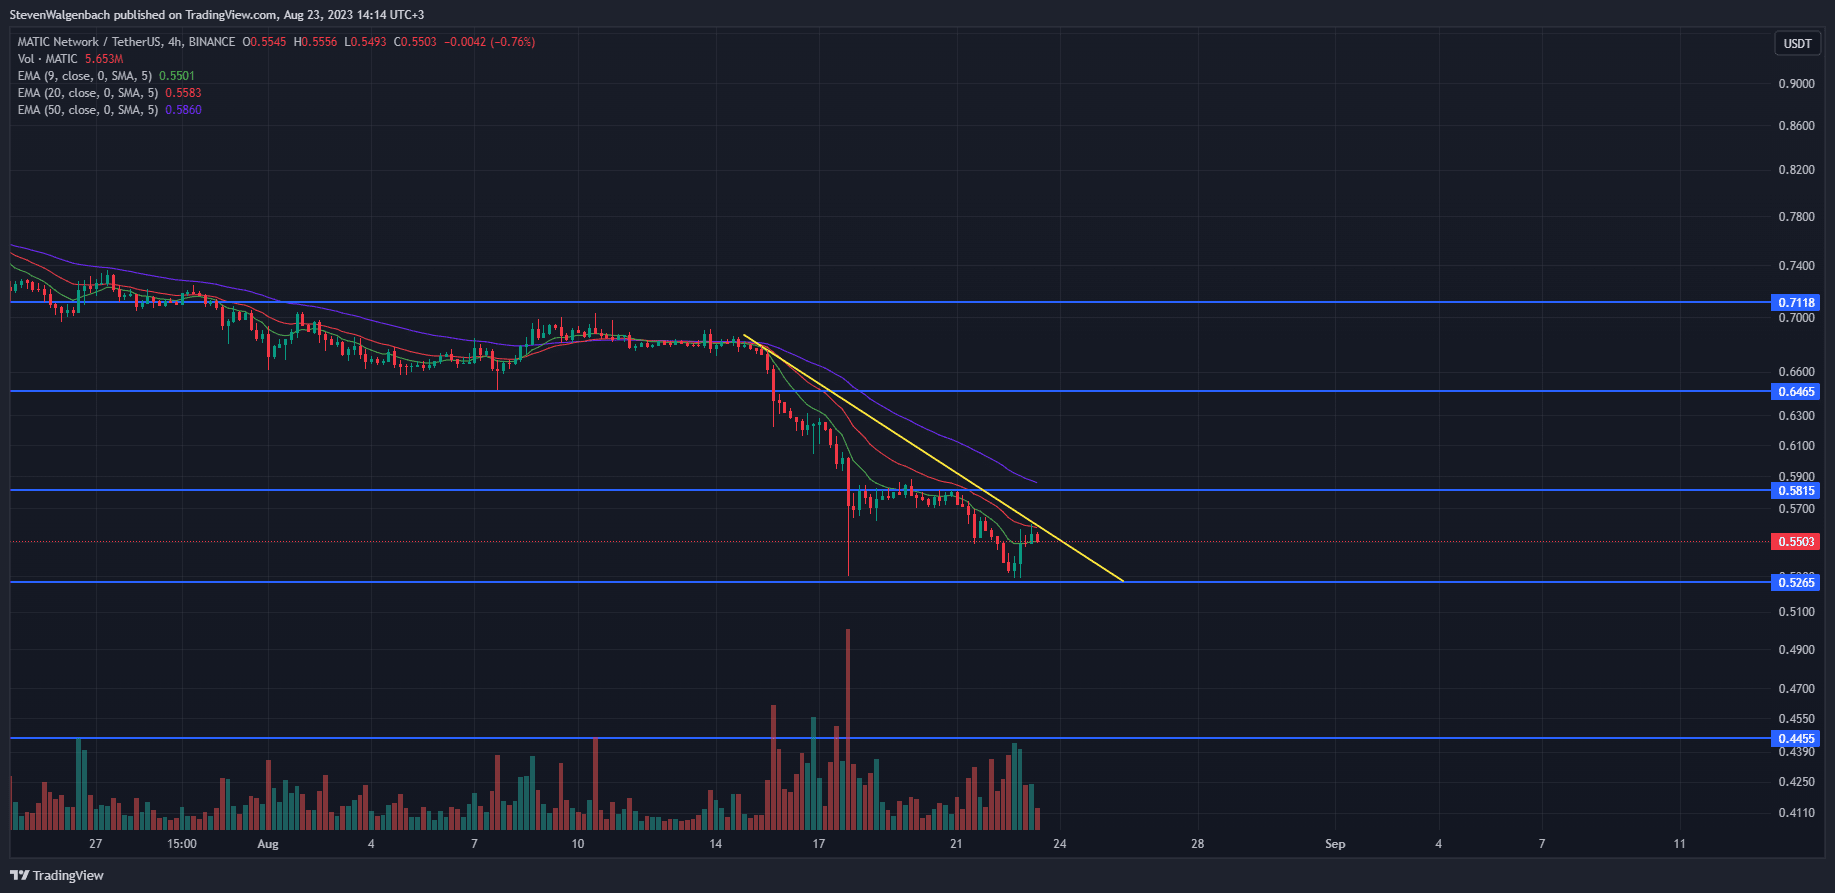
4-hour chart for MATIC/USDT (Source: TradingView)
Looking at the 4-hour chart for MATIC/USDT shows that MATIC’s price may break below the $0.5265 support level during the next 24 hours as a descending triangle had formed. If this bearish chart pattern is validated, the cryptocurrency’s price may drop towards the aforementioned $0.4455 support in the following 48 hours.
Bulls were, however, attempting to break out of the chart pattern at press time, as MATIC’s price was trading slightly under the upper level of the triangle. If buyers succeed in boosting the altcoin to trade outside of the chart pattern, then MATIC may attempt to escape the current bearish trend. A confirmation of this potential reversal will be when MATIC’s price closes a 4-hour candle above $0.5815.
Thereafter, investors and traders may want to keep an eye on the 9 and 20 EMA lines on MATIC’s 4-hour chart for a possible crossing of the 2 technical indicators. Should the 9 EMA line cross above the 20 EMA line, it will signal that momentum for the following 24-48 hours will shift in favor of buyers.
Depending on how traders react to the 2 EMA lines triggering this bullish technical flag, the 9 EMA and 20 EMA lines on the 4-hour chart may also cross above the 50 EMA line. This will indicate that the positive momentum will most likely be sustained - resulting in MATIC continuing its ascent towards the previously-mentioned $0.7118.
Disclaimer: Coinpaper does not recommend that any cryptocurrency should be bought, sold, or held by you. Always conduct your own research and consult your financial advisor before investing in any digital asset.
