
Bitcoin is trying to form a short-term recovery setup after a sharp pullback, with traders watching the $61,000 demand zone. A strong bounce could open the path toward $65,000-$67,000, while a breakdown may shift focus back to $58,000.
Bitcoin Eyes $67K Recovery as Inverse Head-and-Shoulders Takes Shape
Bitcoin is attempting to stabilize after a sharp selloff, with traders watching a potential inverse head-and-shoulders pattern on the 4-hour chart. A confirmed breakout above resistance could open the door for a move toward $67,000, while failure may send BTC back to test key long-term support.
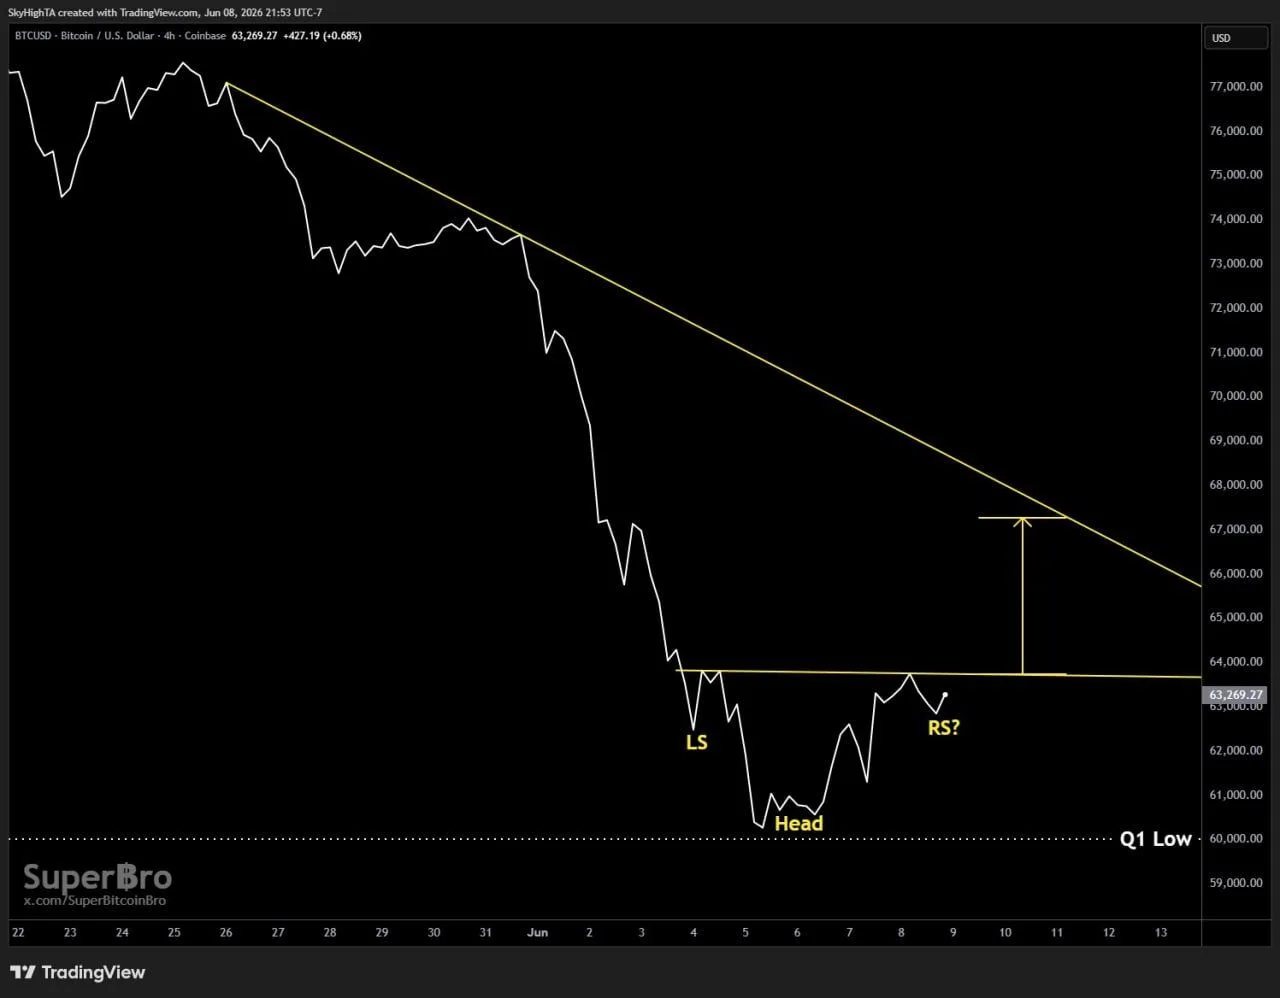
Bitcoin 4-Hour Chart (BTC/USD). Source: SuperBro on X / TradingView
Bitcoin is forming a potential inverse head-and-shoulders pattern, a technical structure often associated with trend reversals. The chart identifies a left shoulder near $62,500, a head around the Q1 low near $60,000, and a possible right shoulder currently developing above $62,000.
According to analyst SuperBro, confirmation requires a 4-hour close above the neckline near $64,300. A successful breakout would complete the pattern and activate a conservative upside target near $67,000.
The chart also shows a descending trendline that has capped Bitcoin throughout the recent decline. A move above both the neckline and trendline would improve short-term market structure and suggest buyers are regaining control after weeks of selling pressure.
From a technical perspective, inverse head-and-shoulders patterns become more reliable after confirmation. Until BTC closes above resistance, the setup remains a potential formation rather than a completed reversal signal.
The downside scenario remains important. If the pattern fails and Bitcoin loses support near the right shoulder region, the analyst expects at least a retest of the weekly 200 Simple Moving Average near $62,000. That level has historically acted as a major long-term support zone during broader market corrections.
For now, the $64,300 resistance level remains the key trigger. A confirmed breakout could shift attention toward $67,000, while rejection would keep pressure on support levels below the current range.
Bitcoin Pullback Targets $61K Support as Traders Watch $65K-$66K Rebound
Bitcoin is pulling back after reaching the $64,200 area, with analyst Kaz watching the $61,000 zone as the next major demand area. The chart suggests a bounce from this level could send BTC back toward $65,000-$66,000, while a failed hold may open the door to a sweep near $58,000.

Bitcoin Short-Term Chart (BTC/USD). Source: Kaz on X
The chart marks the $61,000 area as a strong demand zone where Bitcoin previously found support. According to the analysis, this level is likely to be tested again during the current pullback.
If BTC holds the marked demand zone, Kaz expects price to recover toward the previous high near $64,200 and potentially extend toward $65,000-$66,000. The chart projection also shows a possible choppy move before a larger push higher.
However, the setup depends on support holding. If Bitcoin loses the $61,000 zone, the analyst warns that price could move lower to hunt liquidity around the range lows, with a possible extension toward $58,000.
For now, the short-term focus remains on the $61,000 support area. A strong bounce would keep the recovery setup active, while a breakdown would shift attention back to lower liquidity levels.
