
Bitcoin is losing momentum after rejection near the $82,000 area, with traders now watching whether BTC can hold the $74,917 support level. A deeper pullback could bring the $71,000 to $72,000 zone back into focus as Bitcoin continues to trade inside its rising daily channel.
Bitcoin Price Tests 61.8% Fib as BTC Must Hold $74,917 Support
Bitcoin has pulled back toward the 61.8% Fibonacci retracement level near $77,851, putting the $74,917 support level in focus for the next BTC price move.
The 4-hour chart shared by Man of Bitcoin on X shows BTC trading near $77,989 after failing to hold the higher range near $82,750. The analyst said Bitcoin has reached the 61.8% Fib retracement in wave y of wave (2).
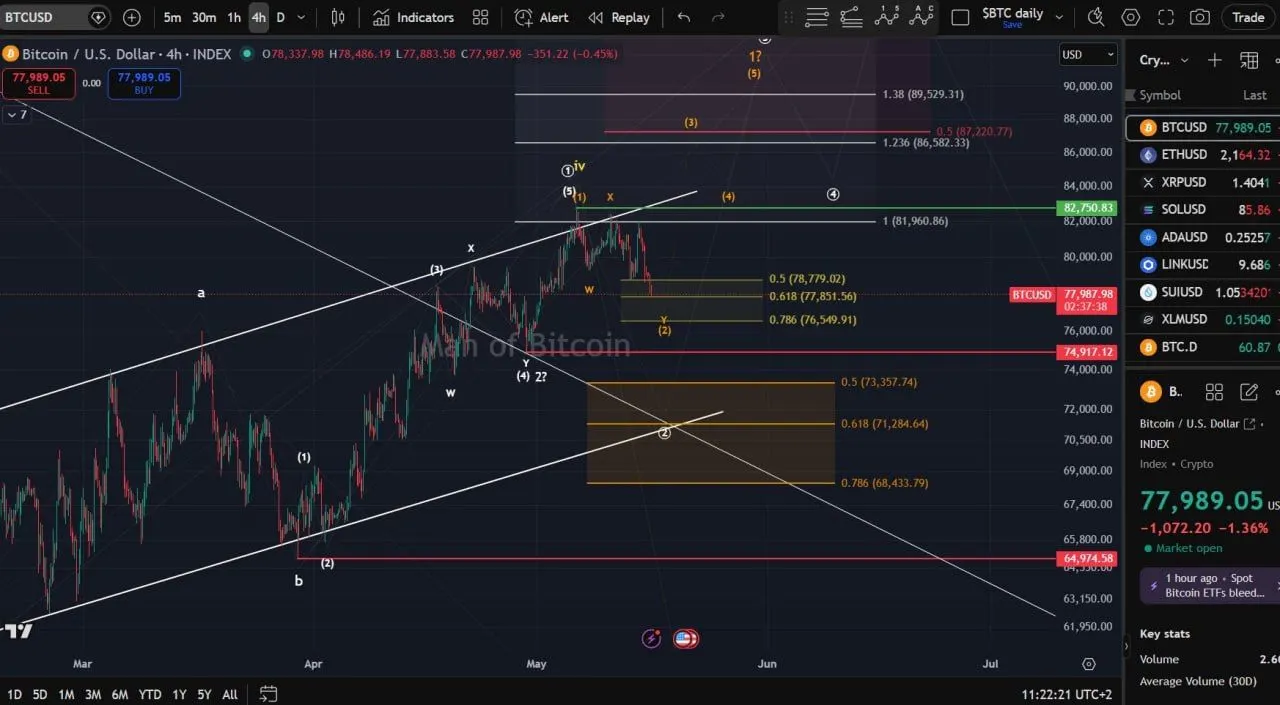
Bitcoin 4-Hour Price Chart. Source: Man of Bitcoin on X
The chart shows short-term Fibonacci levels at $78,779, $77,851, and $76,549. Bitcoin is now trading close to the 61.8% level, which often acts as a key area during corrective moves.
BTC needs to stay above $74,917 to keep the orange roadmap active, according to the chart. That level sits below the current retracement zone and marks the main invalidation area for the near-term structure.
If Bitcoin holds above $74,917, the setup could still allow another move higher. The chart shows resistance near $81,960 and $82,750, where BTC previously struggled.
A stronger rebound could bring the $86,582 and $87,220 area into focus. The higher extension level near $89,529 also appears on the chart as a possible upside target if momentum returns.
However, a break below $74,917 would weaken the orange roadmap. In that case, BTC could move into the deeper support zone between $73,357 and $68,433.
For now, Bitcoin remains in a corrective phase. The key range is clear: support sits at $74,917, while resistance stands near $81,960 to $82,750.
Bitcoin Price Could Retest $71K Support as BTC Pulls Back From Channel Top
Bitcoin is pulling back from the upper boundary of its rising daily channel, putting the $71,000 to $72,000 support zone back in focus.
The daily BTCUSDT chart shared by Captain Faibik on X shows Bitcoin trading near $78,823 after failing to extend above the channel top. The chart shows BTC moving inside an upward-sloping channel since its February low.

Bitcoin Daily Price Channel Chart. Source: Captain Faibik on X
BTC recently reached the upper trendline near the $82,000 area, where the rally lost momentum. The latest candles show a pullback from that zone, suggesting Bitcoin may revisit lower support before attempting another move higher.
Captain Faibik said BTC may retest the $71,000 to $72,000 support zone again. That area sits near the lower half of the rising channel and lines up with a previous reaction zone on the chart.
If Bitcoin reaches that range, buyers would need to defend it to keep the rising channel structure active. A strong bounce from $71,000 to $72,000 could keep BTC inside the broader recovery path.
However, a break below the channel’s lower boundary would weaken the setup. In that case, BTC could lose the structure that has supported the recovery since February.
For now, Bitcoin remains inside the rising daily channel. The main resistance sits near the upper trendline around $82,000, while the key support zone stands near $71,000 to $72,000.
