
Dogecoin is trading at a key point as two charts show both downside risk and a still active recovery setup. DOGE must clear the $0.118 resistance area to strengthen momentum, while the $0.07 to $0.10 zone remains important if selling pressure returns.
Dogecoin Chart Warns of Deeper Drop as DOGE Tests Long Term Channel
Dogecoin showed a bearish higher time frame setup on the three week chart, according to a TradingView chart shared by Crypto Patel on X.
The chart places DOGE inside a long term descending channel that has shaped price action since earlier market cycles. Each major rejection near the upper channel area led to deeper pullbacks, and the latest setup again shows price near resistance.
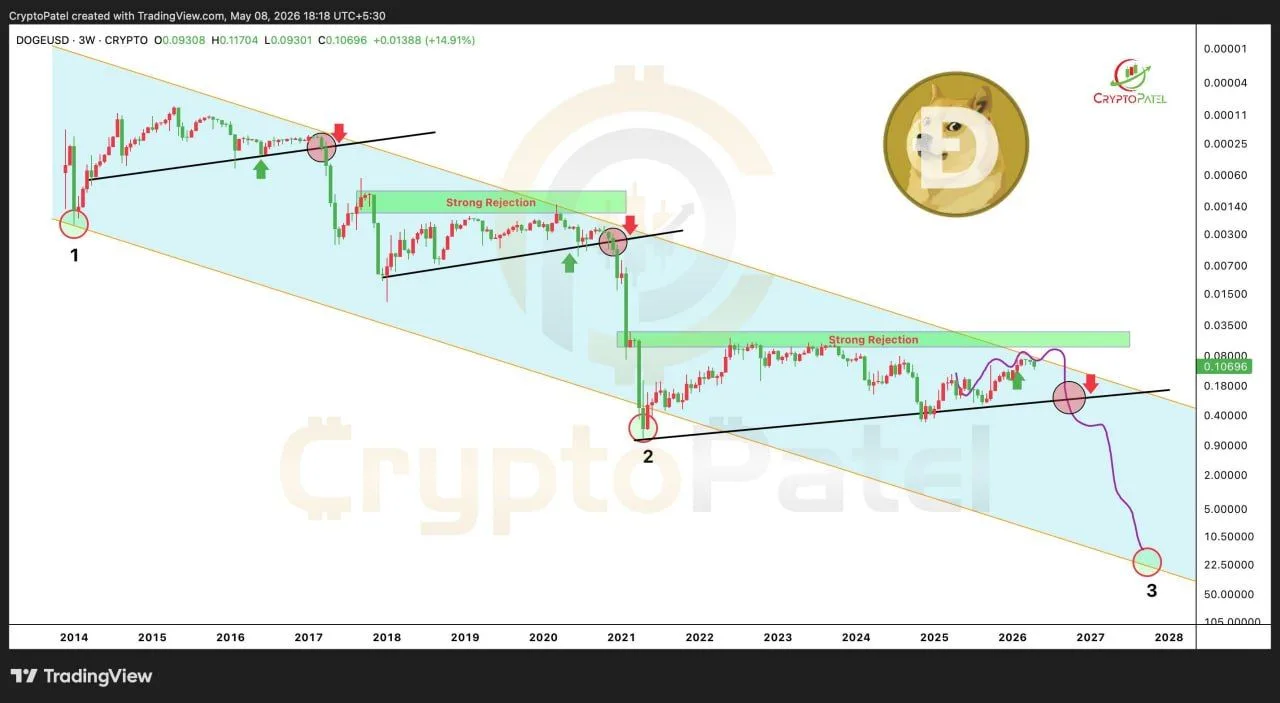
DOGE Long Term Descending Channel. Source: Crypto Patel on X
DOGE also faced a strong rejection zone near the $0.08 to $0.10 area on the chart. The analyst marked this region as important because price failed to break cleanly above it during the latest move.
The chart also points to a possible move lower before any larger recovery attempt. Crypto Patel marked the $0.10 to $0.07 area as an accumulation zone, suggesting that this range could become important if selling pressure continues.
However, the same chart still shows much higher long term targets at $1, $2, and $5. These targets depend on DOGE holding its broader market structure and eventually breaking away from the descending channel.
For now, the chart shows a mixed setup. Dogecoin faces downside risk after another rejection, but the analyst still frames the lower support zone as the main area to watch before any larger bullish continuation.
Dogecoin Holds Recovery Structure as DOGE Faces 0.618 Resistance
Dogecoin remained in a recovery setup on the weekly chart, according to a TradingView chart shared by Surf on X.
The chart shows DOGE breaking above a descending trendline after a long correction from its previous local high. However, price is now testing the 0.618 Fibonacci level near $0.118, which acts as short term resistance.

DOGE Weekly Fibonacci Resistance. Source: Surf on X
DOGE also holds above the 0.786 Fibonacci level near $0.080. That area remains an important support zone because it marked the lower part of the recent correction.
The RSI panel also shows a breakout from a long descending trendline. This suggests momentum has improved after months of weakness, although DOGE still needs stronger follow through above resistance.
For now, the chart points to a healthy correction rather than a broken structure. A clean move above the $0.118 area would strengthen the recovery setup, while a drop back toward $0.080 would put support back in focus.
