
Bitcoin is sitting at a key short term turning point after a new CME gap opened near $67,500 while a separate chart showed a third rejection from a rising trendline. Together, the setups point to one clear question: whether Bitcoin will pull back to fill the gap first or break resistance and shift momentum back to buyers.
Bitcoin CME Gap Opens Near $67,500 as Traders Watch for Possible Retest
Bitcoin opened a new CME gap near the $67,500 level after a sharp move higher on the 1 hour CME chart shared by Ted. The image shows BTC jumping from the low $67,000 area to above $69,000, leaving an untraded zone between roughly $67,200 and $67,500. In market terms, that empty range is what traders call a CME gap.

Bitcoin CME Gap Chart. Source: Ted
The chart also shows that Bitcoin pushed as high as the $70,000 area after the jump. As a result, price moved well above the highlighted gap zone in a short time. That kind of move often draws attention because traders regularly watch whether price will return to test the gap before continuing higher.
Ted said most CME gaps get filled within a week, so the $67,500 region has become an area to watch. In other words, if Bitcoin pulls back in the near term, traders may look for a move into that gap zone first. A drop toward that level would not automatically change the broader trend, but it would show that the market is revisiting an unfinished area left by the breakout.
At the same time, the chart does not show weakness yet. Instead, it shows strong upward momentum, with buyers pushing BTC from around $67,200 to above $70,000 in a fast move. Because of that, the gap should be treated as a support watch zone rather than proof that a reversal must happen.
If Bitcoin stays above the upper $69,000 area, bulls may try to keep control and extend the move. However, if momentum slows, the CME gap around $67,500 could become the first key downside target. Therefore, the current setup leaves traders watching two things at once: whether BTC can hold its breakout and whether the newly formed gap gets filled.
Bitcoin Faces Third Rejection at Rising Trendline as Short Term Pressure Builds
Bitcoin is facing another rejection from a rising trendline that has capped price several times in recent weeks. The 8 hour chart shared by Elja shows three separate failures near the same ascending resistance zone, with each rejection marked by red arrows. That repeated response suggests sellers are still defending the trendline.
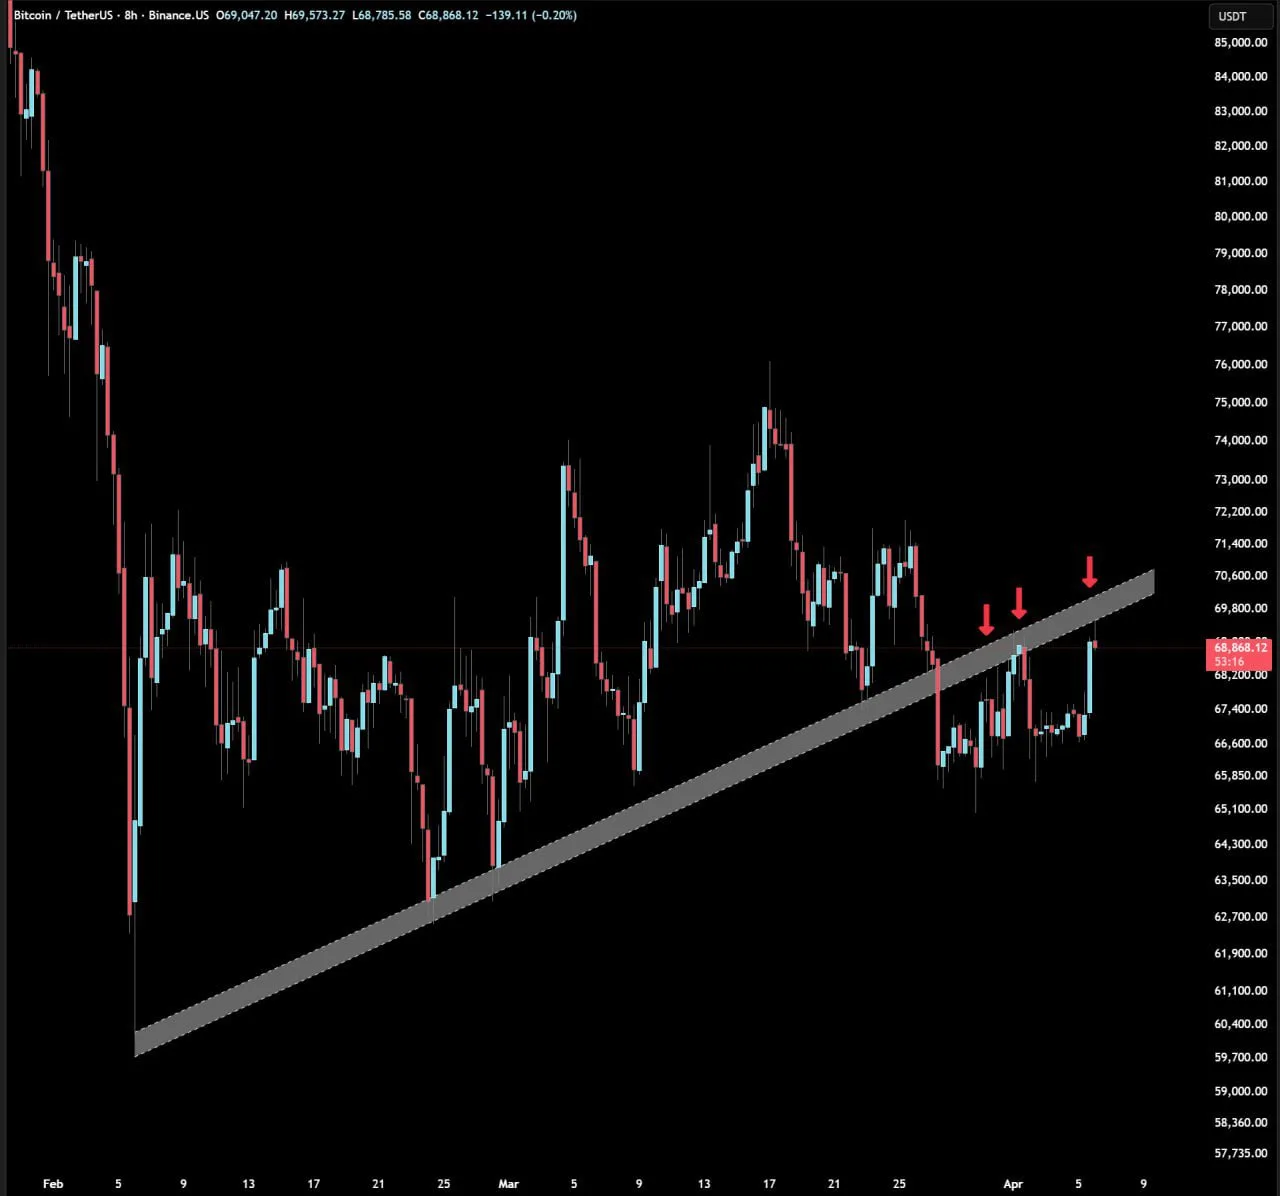
Bitcoin Trendline Rejection Chart. Source: Elja
The latest candle structure also points to fresh hesitation. According to the chart, the recent rejection is forming a shooting star, a candlestick pattern that often appears when buyers push higher but fail to hold control into the close. In this case, the long upper wick shows that upside momentum weakened near resistance.
Because of that, the trendline remains the key short term barrier. The chart shows Bitcoin recovering from lower levels over the past two months, yet every approach into this diagonal resistance has stalled. In other words, the market has not confirmed a breakout, even after multiple attempts.
That matters for the near term outlook. As long as Bitcoin stays below the trendline, the chart does not support a strong bullish case in the short run. Instead, the repeated rejections keep the structure neutral to bearish over the short term, especially if sellers continue to reject rallies at the same level.
At the same time, the setup is still clear. A clean move above the trendline would weaken the rejection pattern and could shift momentum back toward buyers. Until then, traders will likely keep watching whether Bitcoin gets rejected again or finally breaks through the ceiling that has held since February.
