
Bitcoin price prediction is splitting between a possible cycle bottom near $50,000 to $63,000 and a short term breakout setup targeting $71,600. While Plan C argues the worst drawdown may already be in, Captain Faibik’s chart points to a falling channel that could break higher if resistance gives way.
Plan C flags $50,000 to $63,000 as key Bitcoin drawdown zone
Crypto market commentator Plan C said Bitcoin may have already reached the deepest drawdown he expected in this cycle, arguing the downturn could stop well short of the 80% to 90% declines seen in past cycles. In a post on X, he said he had long anticipated a maximum drawdown of about 50% to 60%.
Plan C said that range, measured from Bitcoin’s all time high, points to a $50,000 to $63,000 zone. He added that Bitcoin has already traded in that area, and he said he would not be surprised if the 2026 low is already in.
He also said he does not expect the typical four year cycle pattern to hold, including the idea that major lows must arrive in the fourth quarter of the year. Looking ahead, he said he is focused on the next Purchasing Managers’ Index reading, describing it as a business cycle signal due in the coming days.
Bitcoin price eyes $71,600 as BTCUSDT forms falling channel on 30 minute chart
Meanwhile, Crypto analyst Captain Faibik said Bitcoin is preparing for another bullish rally, setting a near term target of $71,600. In a post on X, he pointed to a developing setup on the BTCUSDT 30 minute chart and argued that price action suggests an upside move could follow.
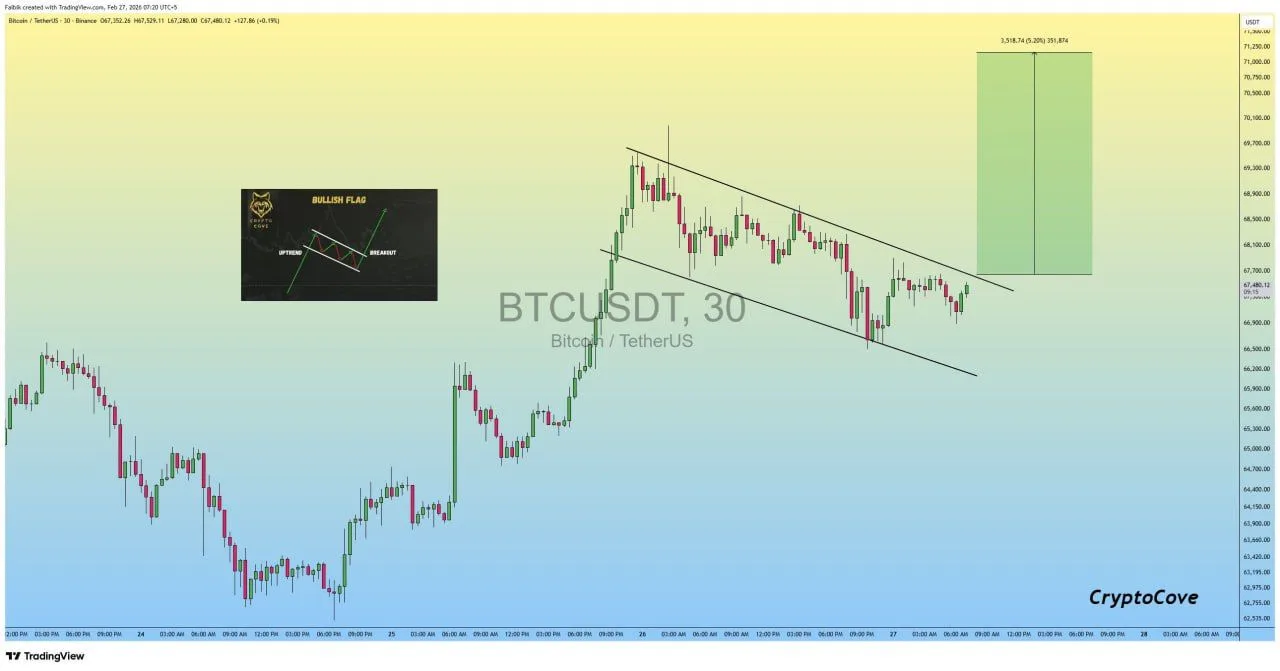
BTCUSDT, 30 Bitcoin TetherUS: Source: Captain Faibik on X
The chart, labeled BTCUSDT, 30 Bitcoin TetherUS on Binance, shows Bitcoin trading inside a downward sloping channel after a sharp push higher. Price climbed strongly before entering a consolidation phase marked by lower highs and lower lows within parallel trendlines. At the time of the snapshot, Bitcoin traded near $67,480, while the upper boundary of the channel capped recent attempts to break higher.
Faibik’s projection toward $71,600 implies a breakout above the descending resistance line.
The chart also highlights a measured move box above current price, indicating a potential extension toward the prior highs near the $70,000 to $71,000 region. However, until price clears the upper trendline with sustained momentum, the structure remains a short term corrective channel following the earlier rally.
