
Solana faces a decisive moment as price action tightens between stubborn resistance and firm support. The token trades at $85.95 as of press time after a 4.15% daily drop.
However, it still holds a 5.05% gain over the past week. With $5.18 billion in daily volume and a $48.9 billion market cap, participation remains strong. Consequently, analysts believe the next move could define Solana’s short-term structure.
Resistance Caps Immediate Upside
CryptoPulse highlights the $88 to $90 zone as a major ceiling on the 12-hour chart. Price recently rebounded from $76 support and quickly approached this barrier.
However, bulls have not secured a decisive breakout above $90. Hence, failure at this level could trigger a rotation back toward $81 mid-range support. A deeper rejection may even revisit the $76 demand area.
Moreover, traders notice repeated hesitation near $90. That behavior signals active sellers defending the level. If buyers clear $90 with conviction, upside momentum could accelerate rapidly. Until then, the range remains intact and traders expect choppy conditions.
Micro Support Keeps Bulls Engaged
Morecryptoonl focuses on the $83.50 level as critical micro support. This area aligns with the 50% retracement and sits near the 38.2% level around $85.45.
As long as price holds above $83.50, analysts favor one more push toward $90 to $94. That move could complete a fifth wave advance in the current structure.
However, a direct drop into $83.50 would signal a deeper wave four pullback. Consequently, the risk of revisiting $78 or even $75.47 would increase. Traders therefore monitor intraday reactions around this pivot. Additionally, strong defense at this level would reinforce bullish confidence.
Higher Timeframe Hints at Bottom Formation
Source: X
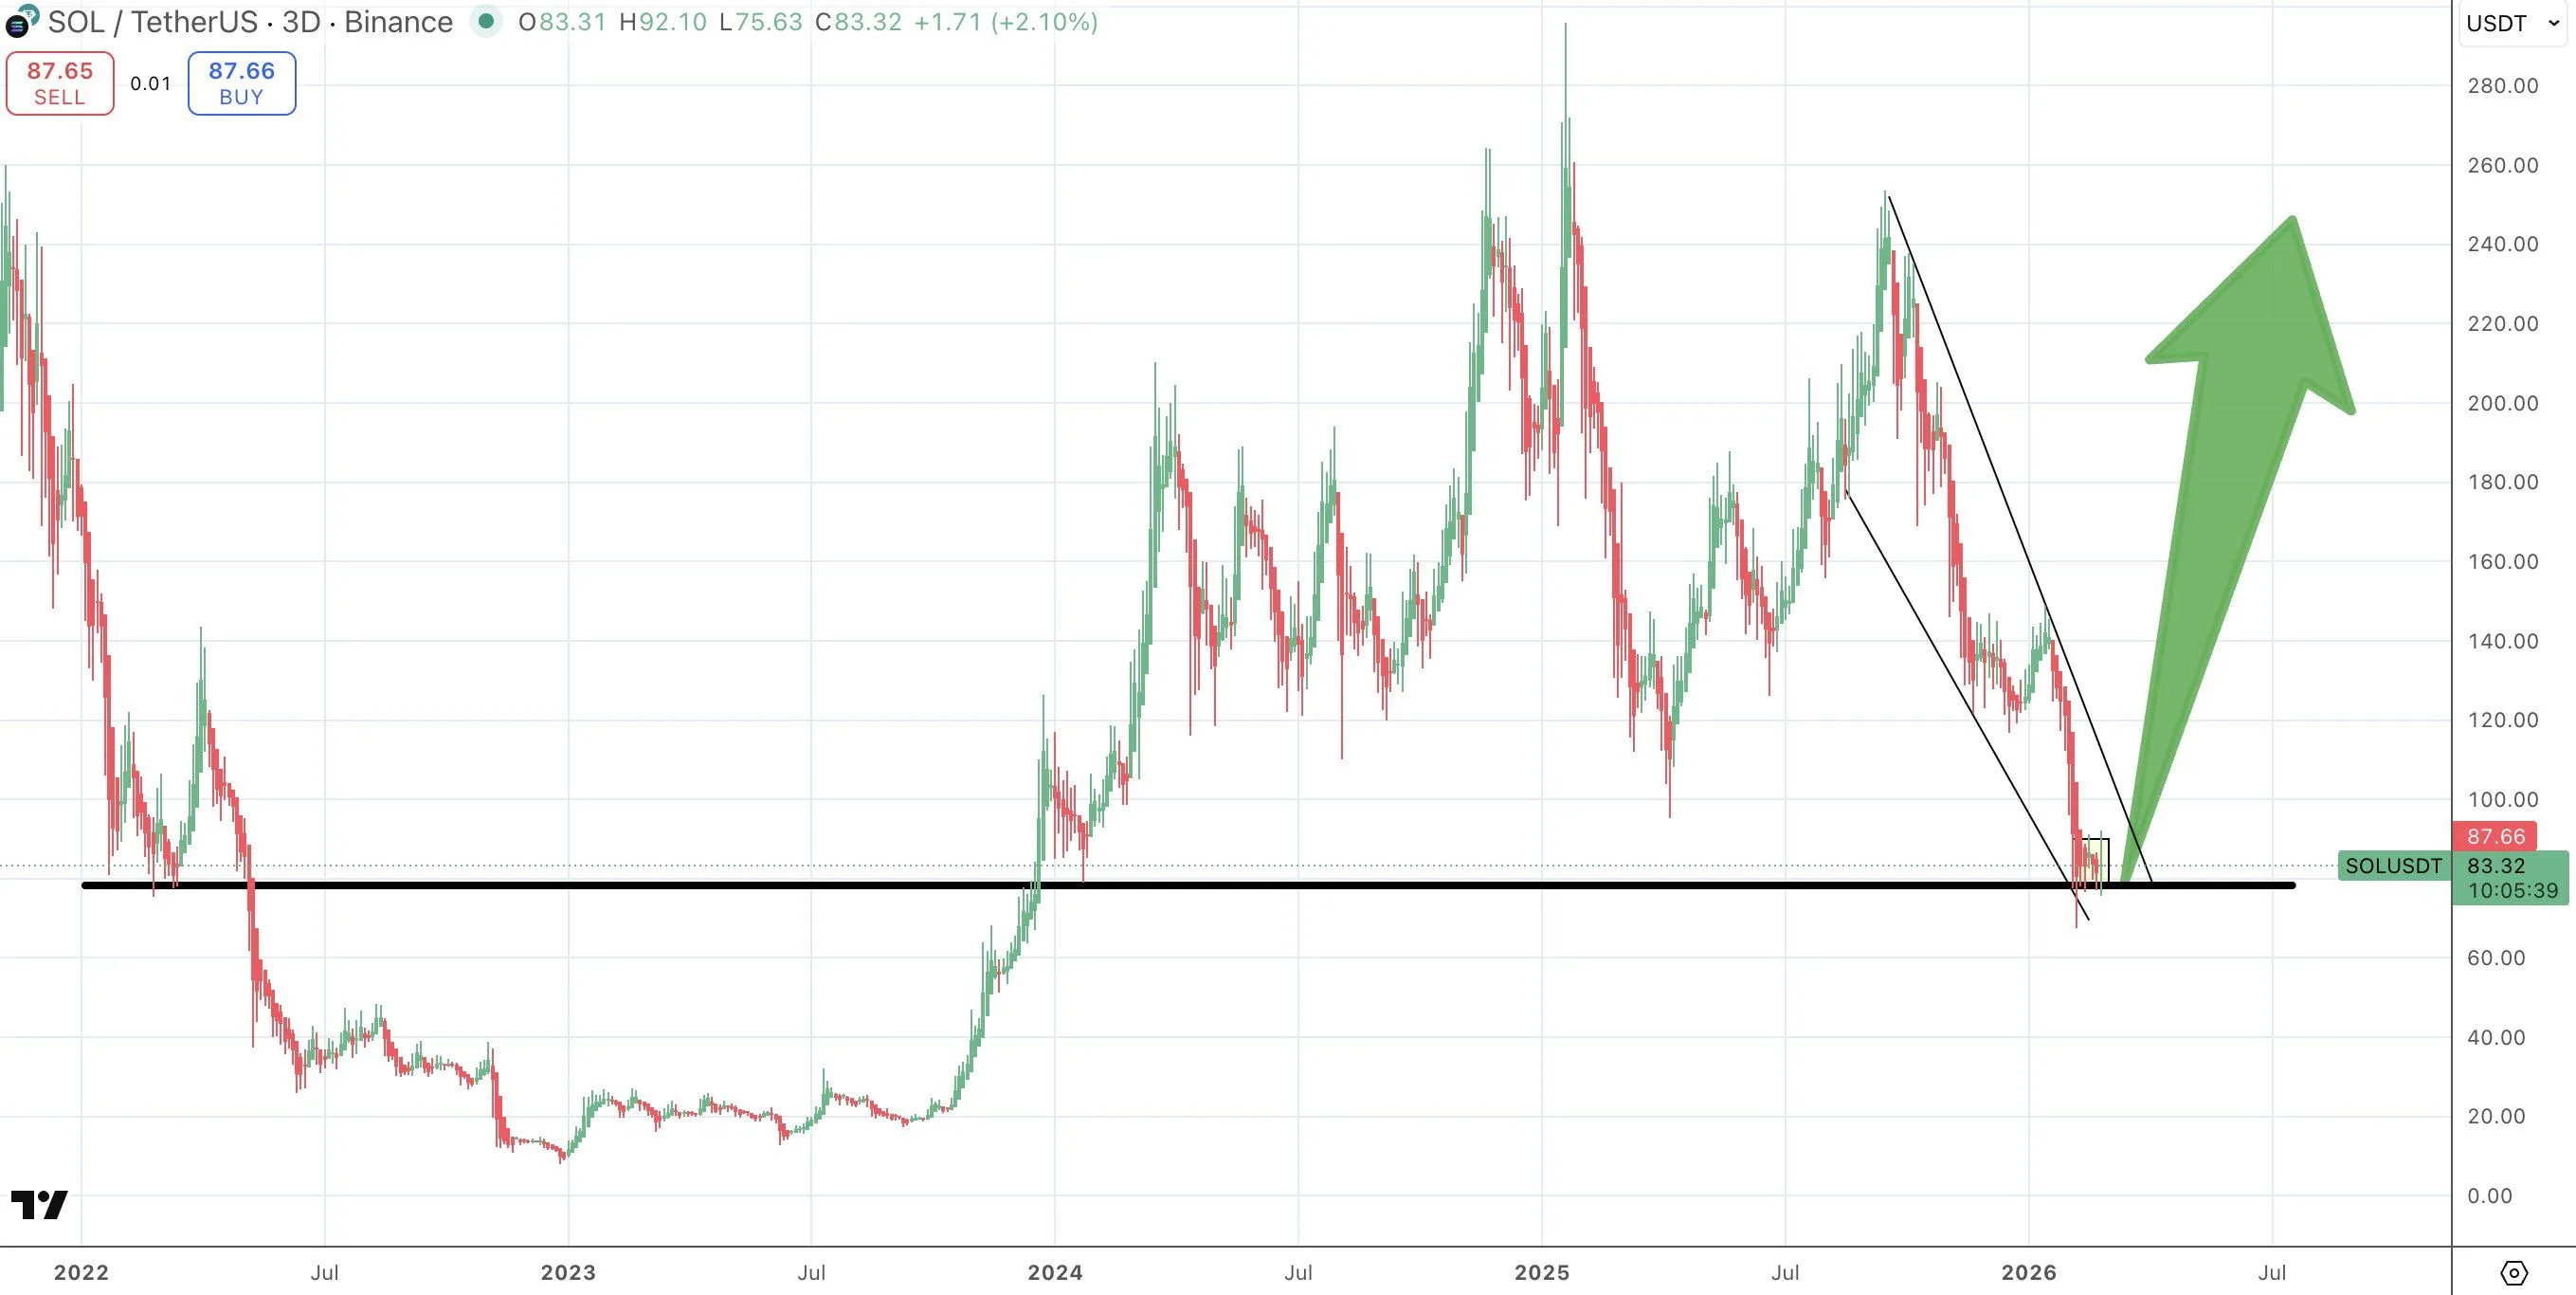
Satoshi Flipper shifts attention to the three-day chart. He identifies the $75 to $85 band as a major historical support. This zone previously acted as resistance in 2022 and support in early 2024. Significantly, price now retests this area after falling from $240 highs.
Descending trendline pressure converges into the same demand region. Meanwhile, sell candles shrink, suggesting fading bearish momentum.
If $75 holds, analysts project a relief rally toward $120. Moreover, a sustained recovery could target $160 to $180 later. However, a clean break below $70 would weaken the bullish thesis and expose $55.
