
Bitcoin’s short term Sharpe ratio sank to near minus 38, a level CryptoQuant data linked to past cycle stress zones. Meanwhile, BTC hovered near $67,987 as chart watchers focused on a weekend micro support band between $66,190 and $66,946.
Bitcoin short-term Sharpe ratio revisits historical stress zone
Bitcoin’s short-term Sharpe ratio has fallen to an extreme negative level that CryptoQuant data and an analyst post on X linked to past cycle lows. The reading on the chart sits near –38, a zone the post described as historically rare and previously seen during periods when Bitcoin traded under heavy stress.
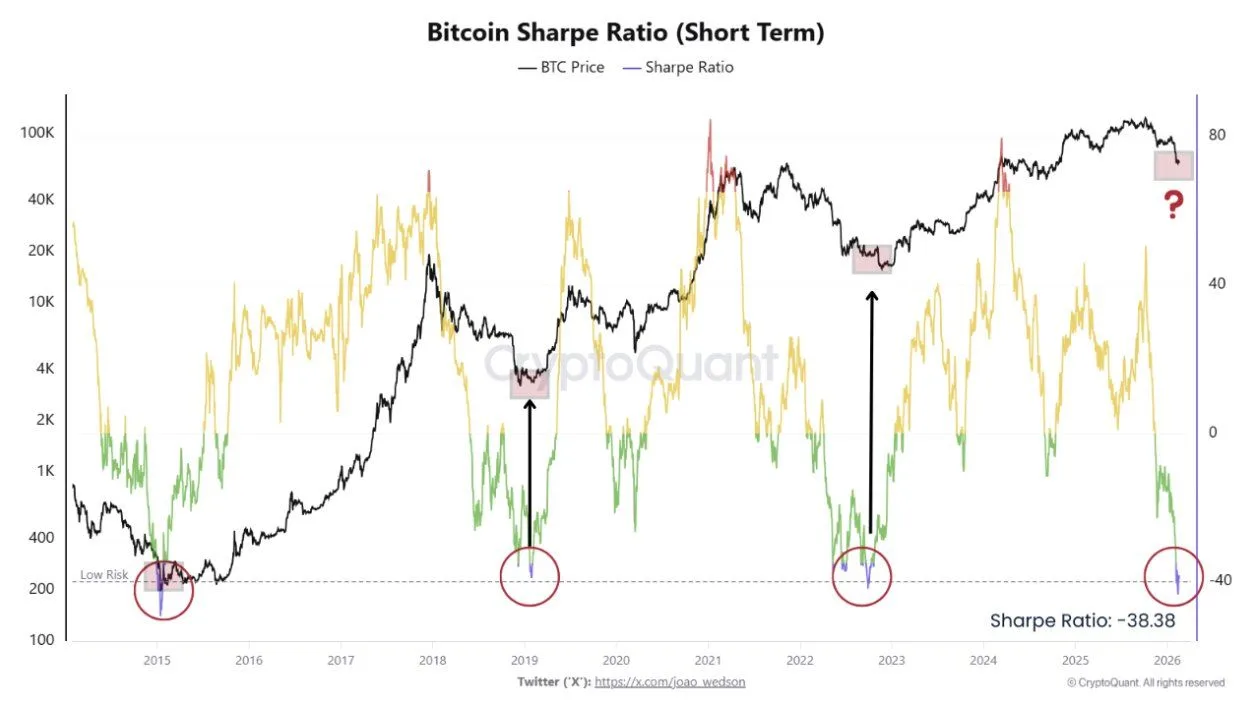
Bitcoin Short Term Sharpe Ratio. Source: CryptoQuant
The chart overlays Bitcoin’s price with the short-term Sharpe ratio and highlights similar extremes around 2015, 2019, and 2022. In each instance, the indicator dipped far below zero as short-horizon returns weakened and volatility rose. Then, price later recovered and eventually pushed to higher levels, which the analyst framed as a repeat pattern in risk-adjusted terms.
This move lower in the Sharpe ratio follows a run-up into late 2024 and a cooling phase afterward. As price action slowed, volatility stayed elevated, so the risk-adjusted measure compressed quickly. Therefore, the metric slipped into the same band that earlier marked capitulation-style conditions on shorter time frames.
The historical examples in the chart show the Sharpe ratio improving after those deep negatives, alongside a steadier price structure. However, the indicator tracks short-term risk-adjusted performance rather than confirming a full trend shift. As a result, the current signal shows stress in the short window, while the next direction still depends on how price and volatility develop from here.
Micro support at $66,190–$66,946 frames short term BTC setup
Bitcoin traded near $67,987 on a 15 minute BTCUSD index chart as analyst group More Crypto Online said price may be forming a B wave inside what they labeled white wave 2. The update framed the current move as a bounce phase after the recent drop, while the chart kept a downward sloping trendline overhead that price has started to challenge.
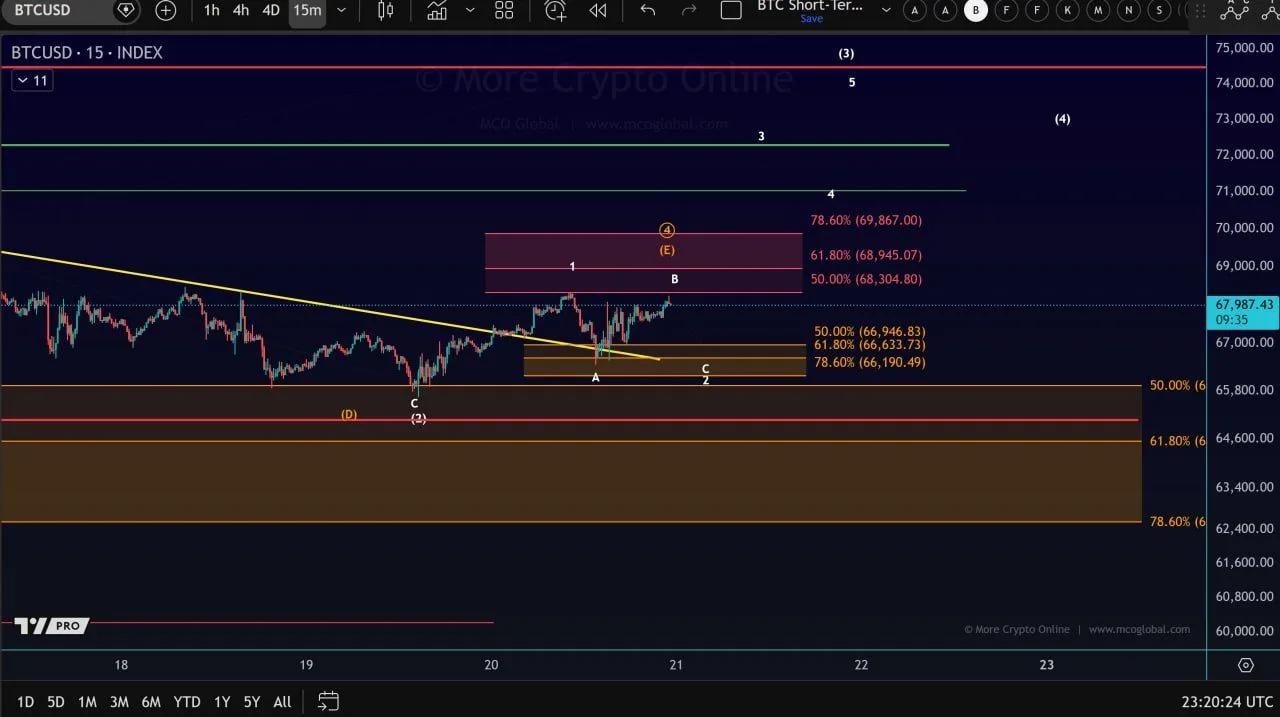
Bitcoin 15 Minute BTCUSD Index Chart. Source: More Crypto Online
More Crypto Online marked a micro support zone between $66,190 and $66,946 and said the white scenario remains the lead case as long as $66,190 holds. Because that band sits just below current price, it acts as the nearest buffer if BTC retraces during the weekend session.
On the upside, the analyst set $68,304 as the first resistance level. The chart also showed a higher resistance box above, with Fibonacci references labeled around $68,304, $68,945, and $69,867, which clustered into a near term ceiling if price continues higher.
