
Bitcoin traders highlighted two competing setups, with one calling for a monthly pullback low and another watching for a final intraday push before a short term top.
Trader Tardigrade said Bitcoin may have bottomed after a monthly RSI breakdown, while More Crypto Online said the current 15 minute wave structure could still need one more high toward $73,800 to complete a five wave advance.
Trader Tardigrade says Bitcoin pullback may have bottomed after monthly RSI breakdown
Bitcoin may have hit the low point of its latest pullback after a breakdown in the monthly relative strength index, according to crypto trader Trader Tardigrade, who posts as @TATrader_Alan on X.
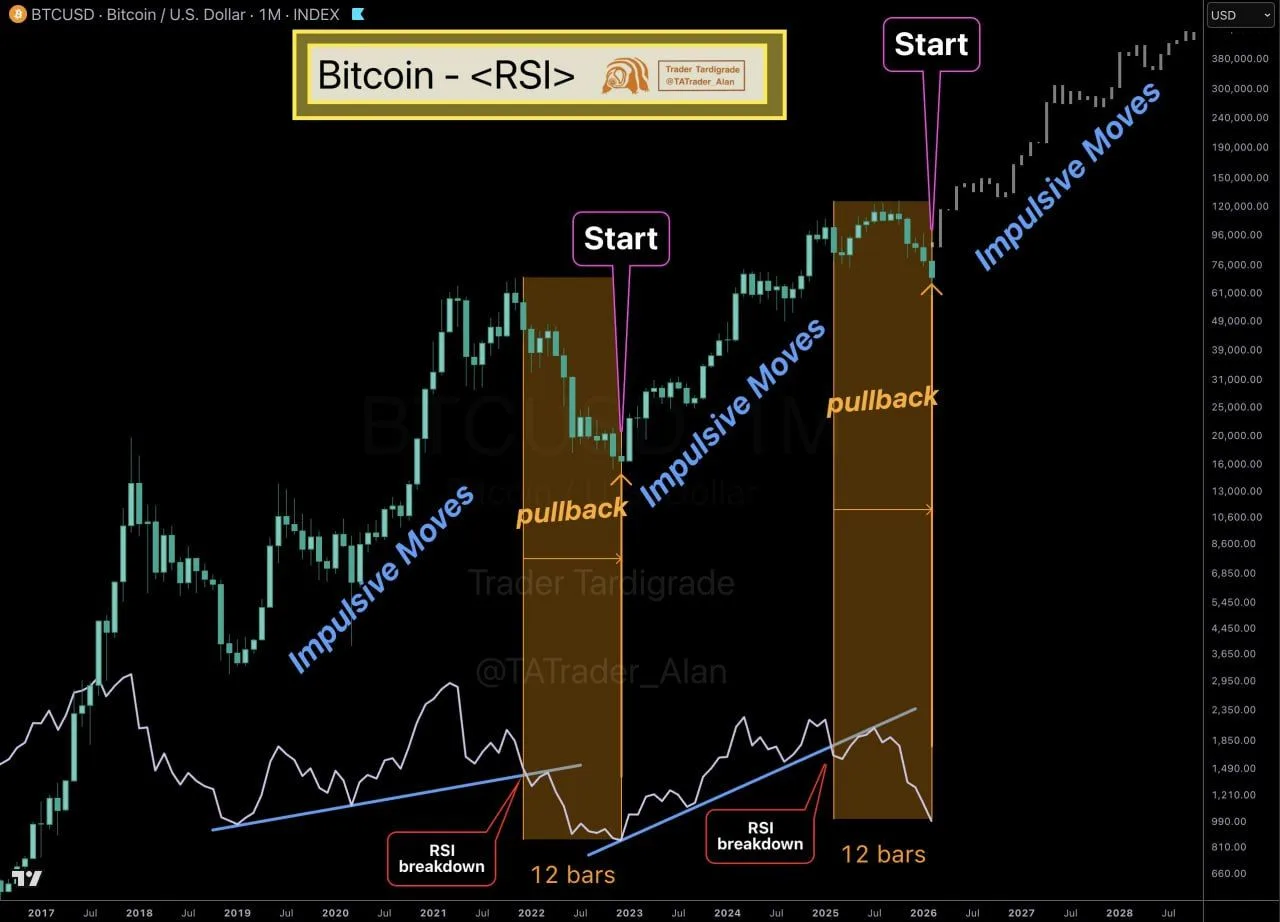
Bitcoin / U.S. Dollar · 1M · INDEX. Source / creator: Trader Tardigrade
In a chart shared with the claim, Bitcoin’s BTCUSD monthly price action appears inside a sequence the trader labels as “impulsive moves” followed by a “pullback.” The graphic highlights two prior “RSI breakdown” moments and marks each pullback as lasting “12 bars,” or about 12 months on the monthly timeframe.
Trader Tardigrade wrote that Bitcoin “may have reached the bottom of its current pullback over the past 12 months” following the RSI breakdown. He added that “the next impulsive move is imminent,” framing the setup as a possible shift from pullback conditions back to trend movement on the monthly chart.
More Crypto Online flags possible Bitcoin top, watches $73,800 for one more high
Bitcoin may have formed a short term price top in wave 5 of (3), according to market analyst More Crypto Online, who posts as @Morecryptoonl on X.
In a TradingView chart labeled BTCUSD on the 15 minute timeframe, the analyst mapped an Elliott Wave structure and said the latest push higher could already mark the peak of the current advance. However, he said he wants to see one more high to confirm a clean five wave move to the upside. He pointed to $73,800 as the preferred level for that final push.
BTCUSD Bitcoin U.S. Dollar 15m INDEX. Source: More Crypto Online (@Morecryptoonl)
The chart also shows price stalling near a local resistance band while holding above a rising support line from the recent low. As a result, the structure suggests momentum has slowed after a strong rebound. At the same time, the wave count places the market late in the current sequence, which raises the risk of a pause or a pullback if the next push fails to extend.
Fibonacci retracement zones on the chart mark nearby downside areas if price rolls over. The 23.6% level sits near $69,720, followed by the 38.2% level near $68,535 and the 50% level near $67,593. Those zones frame potential reaction areas during any short term retracement before the broader structure resolves.
