
Dogecoin's monthly chart shows price sliding toward a long term support zone, as market analyst Ali Charts flagged the $0.054 level as a key area to watch.
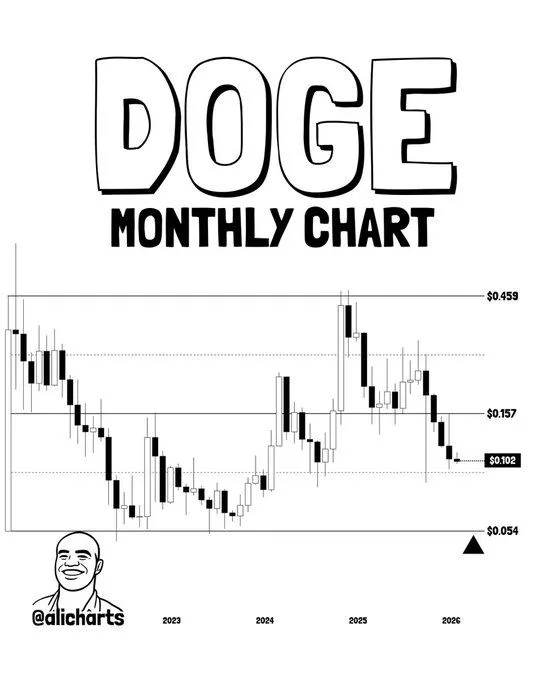
Dogecoin Monthly Chart. Source: Ali Charts on X
In a post on X, Ali Charts said Dogecoin has “solid support” around $0.054 and described that level as the line he is monitoring for a possible rebound.
The chart shows DOGE trading near $0.102, after falling from the mid range marked near $0.157. It also highlights a previous peak near $0.459 before the downtrend accelerated into 2026.
DOGE tests rising trendline as trader calls $0.08 floor
Dogecoin’s DOGEUSDT perpetual chart on the 4 hour timeframe shows price breaking lower and then bouncing at a rising trendline, while multiple moving averages slope downward overhead and frame the broader downtrend.
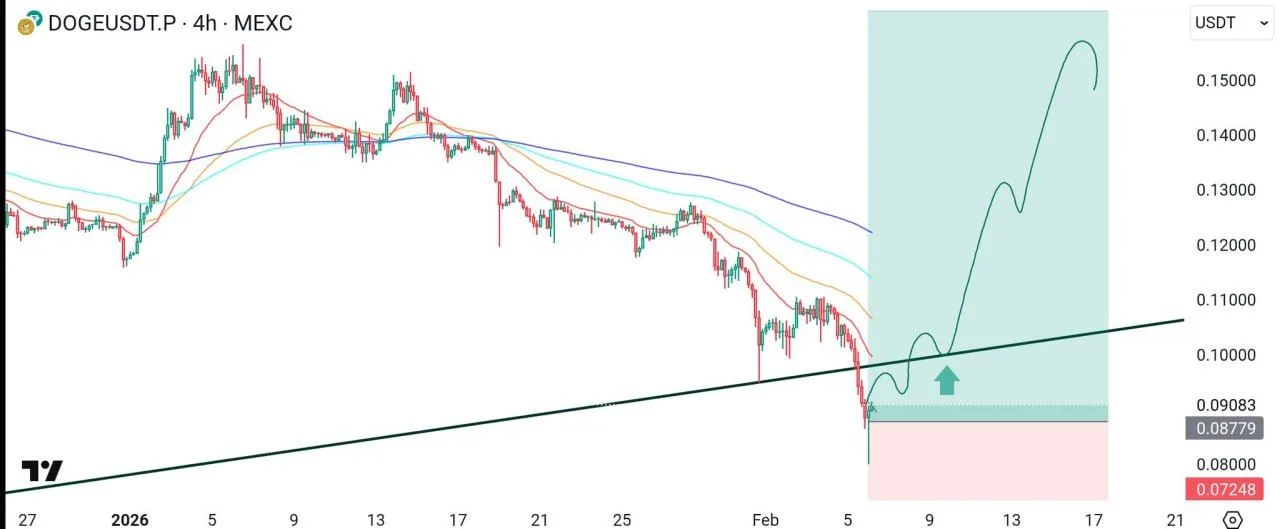
DOGEUSDT Perpetual 4 Hour Chart. Source: Prof Satoshi Nakamoto on X
A TradingView snapshot of the MEXC market shows DOGE trading around the $0.088 to $0.091 area after a sharp drop. The chart also marks a downside level near $0.0725 and a nearby zone around $0.08, which sits below the current price.
In a post on X, Prof Satoshi Nakamoto said he is buying at current levels and claimed DOGE will not fall below $0.08 again, adding that further declines would be a chance to increase exposure. The same chart overlays an upward path that targets the $0.14 to $0.15 area over the following sessions.
Dogecoin monthly chart marks repeated base zones as price compresses
Meanwhile, Dogecoin’s monthly chart highlights a series of consolidation bases that formed before major directional moves, as trader Tardigrade Alan labeled the current structure a “solid base.”
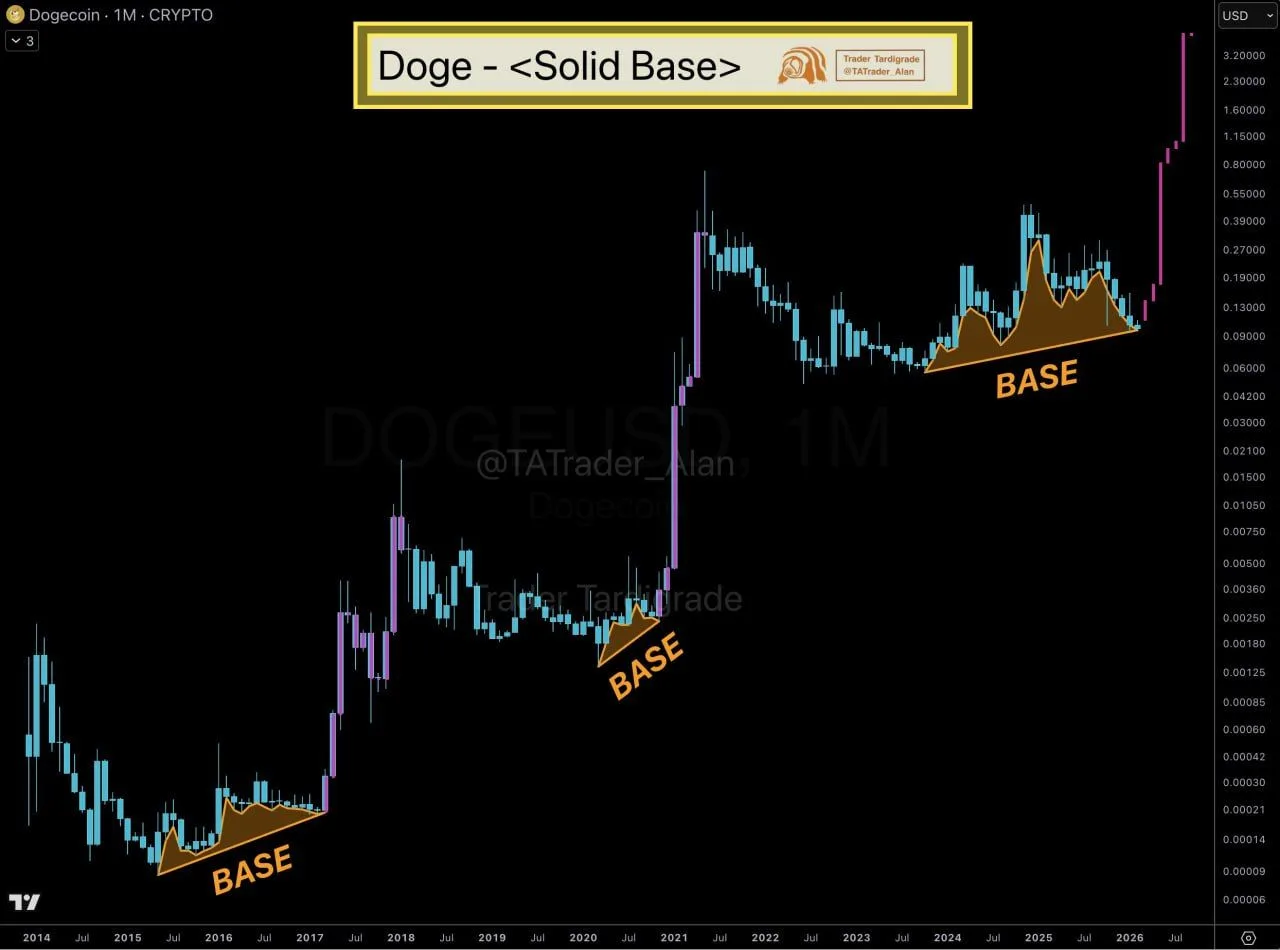
Dogecoin 1 Month Chart. Source: Tardigrade Alan on X
A TradingView monthly view shows DOGE building a rising base in the 2024 to 2026 range, after earlier bases appeared in 2015 to 2016 and again around 2020. Each base sits near the lower end of a sideways range, with price later expanding higher once the range resolved.
The chart also shows DOGE rebounding from the latest base area, with candles pushing into the upper part of the recent range while the base trendline slopes upward.
