
Solana extended its sharp decline as heavy liquidations swept through the derivatives market, reinforcing bearish momentum across multiple timeframes. Over the past 24 hours, more than $300 million in long positions were wiped out, reflecting forced selling rather than organic distribution.
The largest single liquidation reached $6.69 million near the $73 level, highlighting concentrated downside pressure. Consequently, Solana’s price action continues to reflect stress as traders reduce risk amid weakening structure.
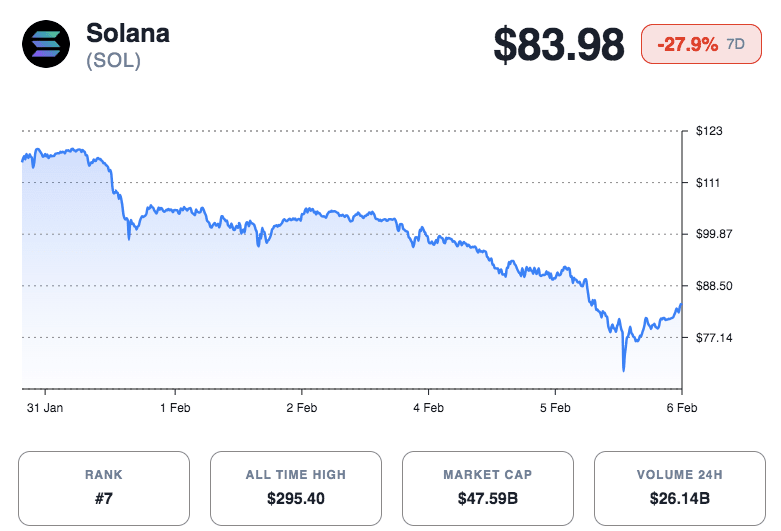
At the time of writing, Solana trades at $83.98, down 6.63% on the day and 27.9% over seven days. Daily trading volume surged past $15.46 billion, signaling aggressive participation during the sell-off.
With a circulating supply near 570 million tokens, Solana’s market capitalization now sits around $47.5 billion. Besides price weakness, rising volume during pullbacks suggests conviction on the downside rather than exhaustion.
Volume Signals Favor Continuation Over Reversal
According to Umair Crypto, Solana lost the $100 point of control from its January 2024 range earlier this month. Price then dropped rapidly into the next high-volume zone between $73 and $67. That move delivered a clean decline of roughly 27%. Subsequently, price bounced about 12% from that region, confirming strong historical interest.
However, Umair Crypto noted a critical shift in behavior. Price now pulls back while volume expands, signaling continuation risk. Hence, market conditions do not support a rapid V-shaped recovery. Instead, Solana must build a base and flip daily structure before any sustainable rebound emerges. Without structure, price lacks trend support.
Resistance Zones Cap Any Relief Bounce
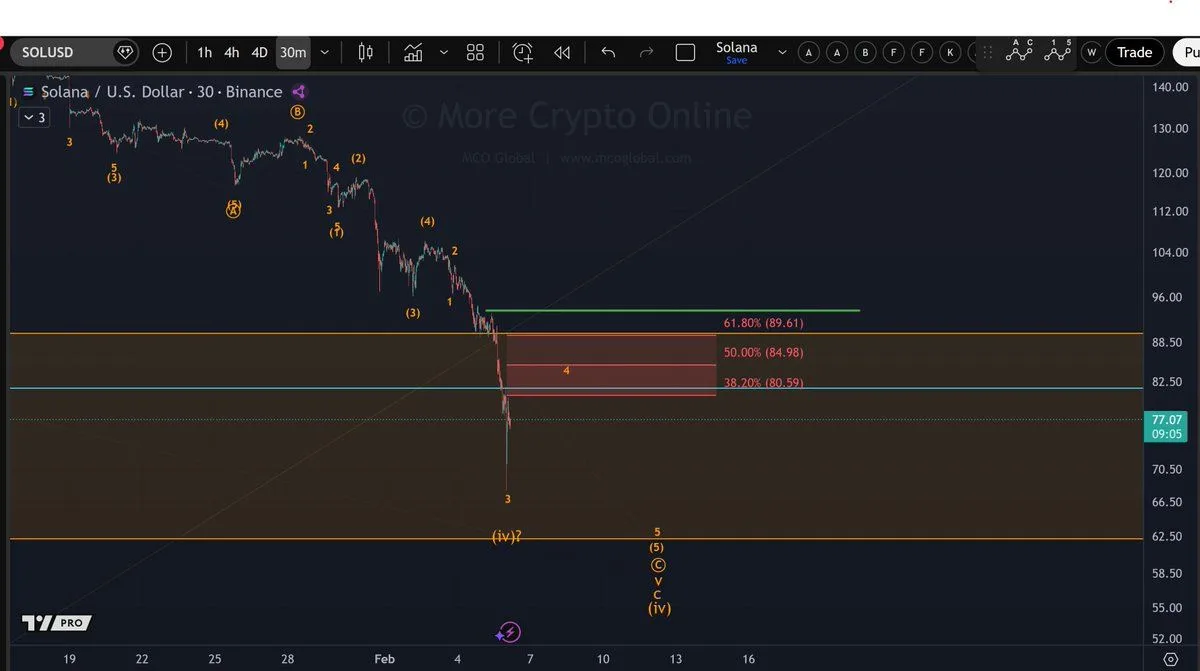
Short-term charts continue to reflect selling dominance. Morecryptoonl observed a strong intraday downtrend on the 30-minute timeframe.
Solana prints lower highs and sharp impulsive declines, confirming bearish control. Additionally, weak dip demand appears after the recent vertical breakdown.
Source: X
Immediate rebound interest sits near $77 to $78. However, overhead resistance remains heavy. The $80.59 to $89.61 zone aligns with the 38.2% to 61.8% Fibonacci retracement range.
Consequently, sellers may defend this area aggressively. Failure to reclaim $89.61 keeps downside targets at $70 and $62 in focus.
Weekly Breakdown Reinforces Macro Bearish Bias
On the higher timeframe, Bitcoinsensus confirmed a macro Head and Shoulders breakdown on the weekly timeframe. The pattern developed over nearly two years. The left shoulder formed near $210. The head peaked above $300. The right shoulder failed near $250, reflecting weakening upside strength.
Significantly, price broke below the neckline around $120 to $125 during the recent sell-off. That move validated the bearish formation.
Immediate support now sits near $100, followed by $80. Historical demand clusters near those levels. However, a decisive loss of $80 exposes the $60 to $65 zone.
