
Bitcoin is defending the mid-$70,000 zone as traders watch a potential flush-and-reclaim setup, a fresh ISM New Orders crossover, and a chart pattern that mirrors Nvidia’s pre-breakout structure. Together, the signals point to volatility first, then a possible push back toward $100,000 if Bitcoin reclaims the broken range on a weekly close.
Bitcoin tests mid $70,000 support as IncomeSharks flags break-and-reclaim risk
Bitcoin traded near $76,332 on the weekly Coinbase chart as price pushed into a long watched support zone around the mid $70,000 area. The level sits inside a prior consolidation band from 2024 that later flipped into a launch point, so the market now treats it as a decision zone.
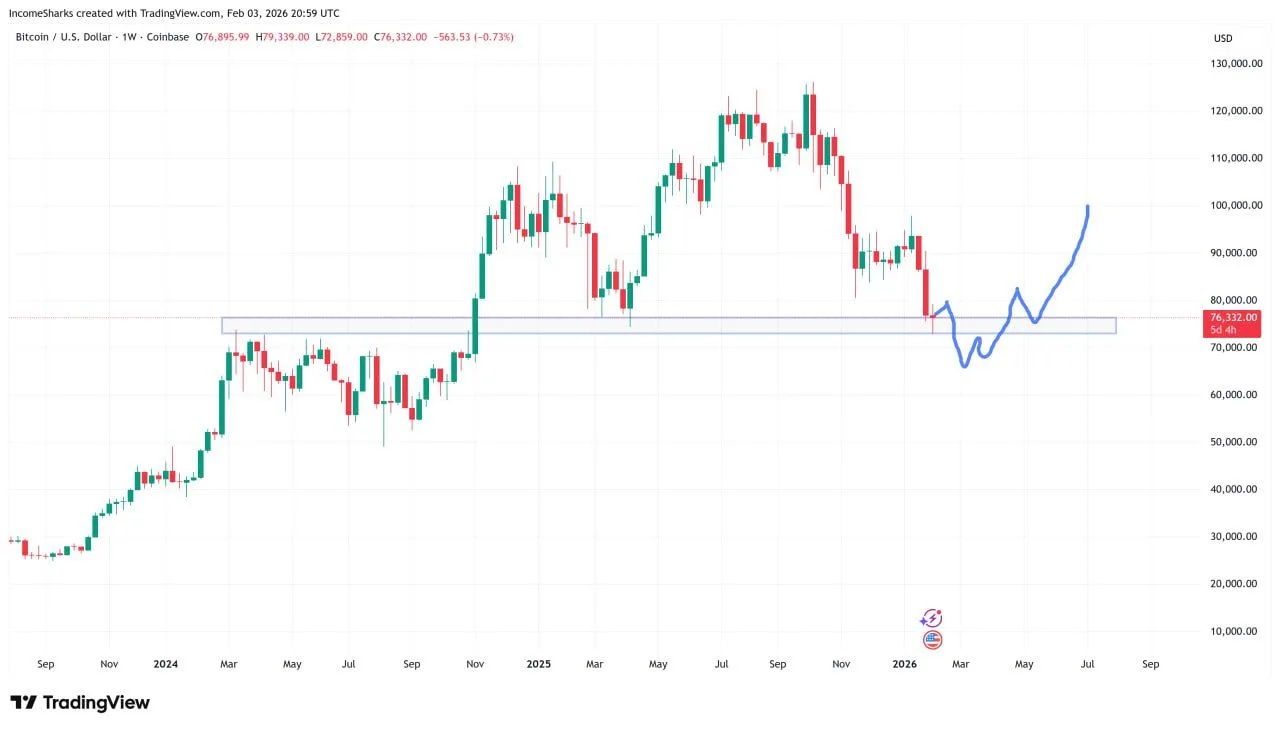
Bitcoin / U.S. Dollar 1W Chart. Source: IncomeSharks via X
IncomeSharks said traders may focus too much on how strong that support looks. When a level becomes crowded, price often breaks it to trigger stops and force exits. That kind of move can print a single, sharp capitulation candle, while bearish targets like $20,000, $40,000, or $50,000 spread across social feeds.
After the flush, the post expects a quick reversal. The chart projection shows a dip below the support box, then a rebound back into the range, followed by a climb toward $100,000. In that setup, Bitcoin regains strength only after it reclaims the broken level and holds it on a weekly close, because that shift signals sellers lost control and buyers regained the range.
Bitcoin tracks ISM New Orders signal again as AO_btc_analyst points to past bull-run setups
Bitcoin sits on the weekly chart as AO_btc_analyst highlighted a recurring macro signal tied to the ISM New Orders Index. In a Feb. 3 post, the analyst said Bitcoin rallied into bull runs each time the ISM crossed the same threshold and added that the index crossed it again.
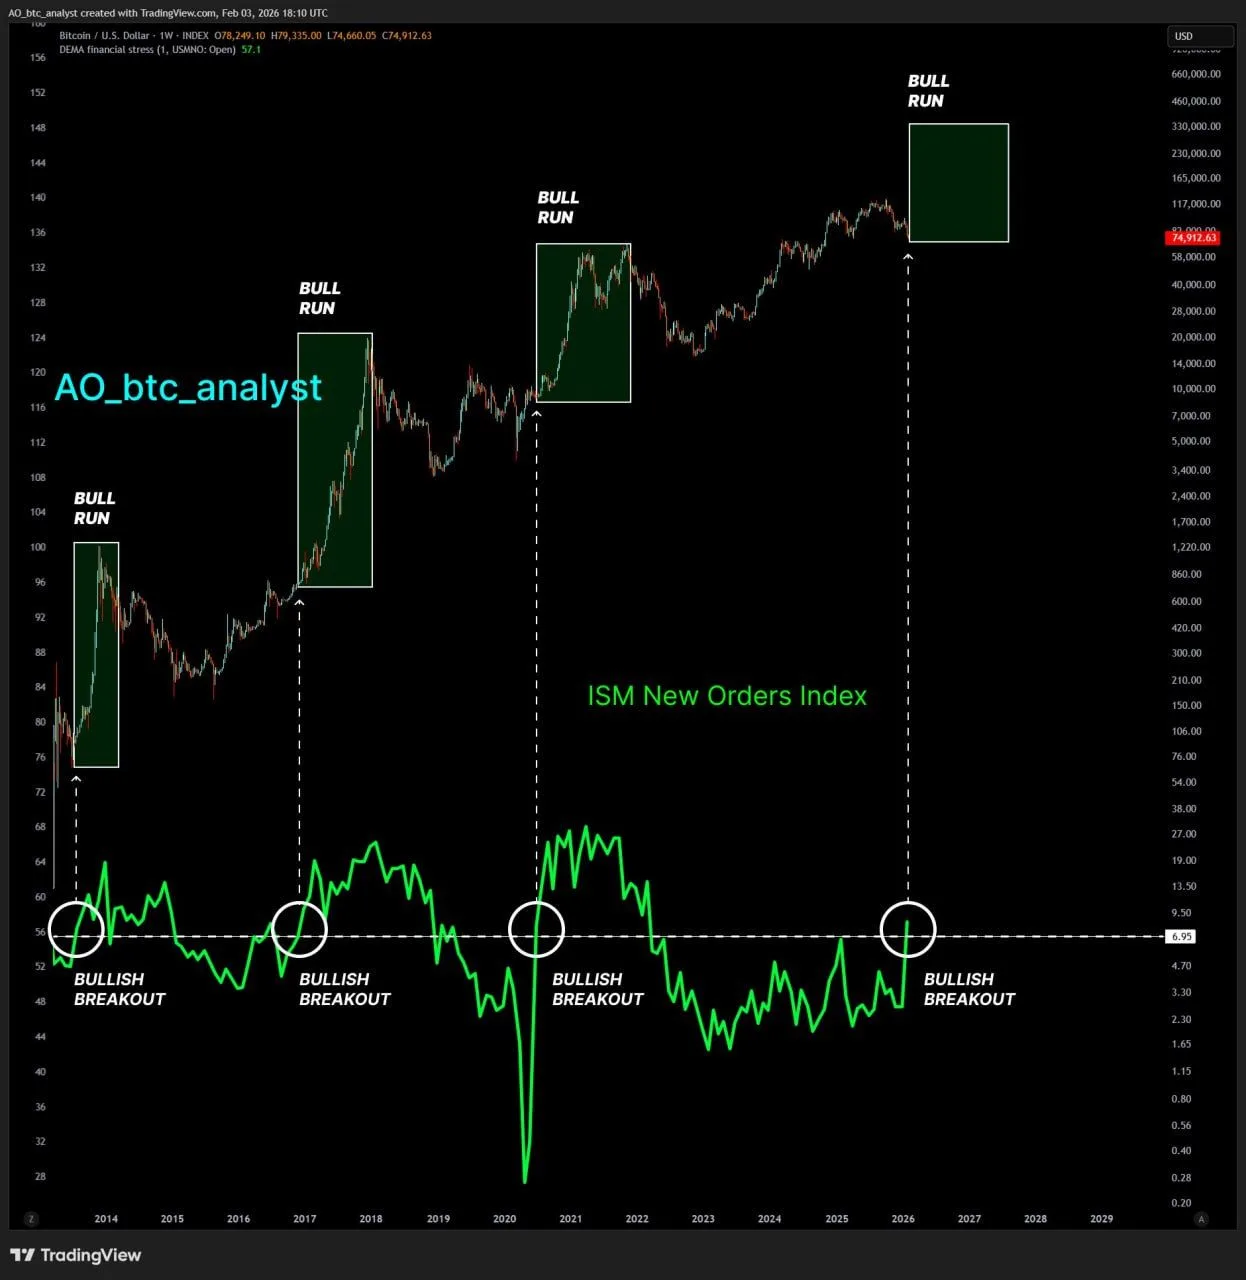
Bitcoin / U.S. Dollar 1W Chart with ISM New Orders Index. Source: AO_btc_analyst via X
The chart plots Bitcoin’s long-term uptrend against the ISM New Orders line and marks several prior crossings with “bullish breakout” labels. Those past signals line up with periods that later saw strong upside extensions in Bitcoin, including the 2013–2014 cycle, the 2017 run, and the 2020–2021 cycle. The latest circle appears near early 2026, where the ISM measure sits around 57.1 on the chart.
This setup frames the ISM crossing as a risk-on trigger that can coincide with improving demand conditions. Still, the signal does not guarantee timing or magnitude, because markets can lag macro data and react to other shocks. Even so, the post argues that the repeat crossing increases the odds that Bitcoin attempts another sustained upside phase from current levels.
Bitcoin and Nvidia show similar channel breaks and rebounds on weekly charts, JamesEastonUK says
Meanwhile, JamesEastonUK compared its recent structure to Nvidia’s pre-rally setup. In a Feb. 3 post on X, the analyst said Bitcoin’s price action looks similar to Nvidia’s pattern before its sharp upside move.
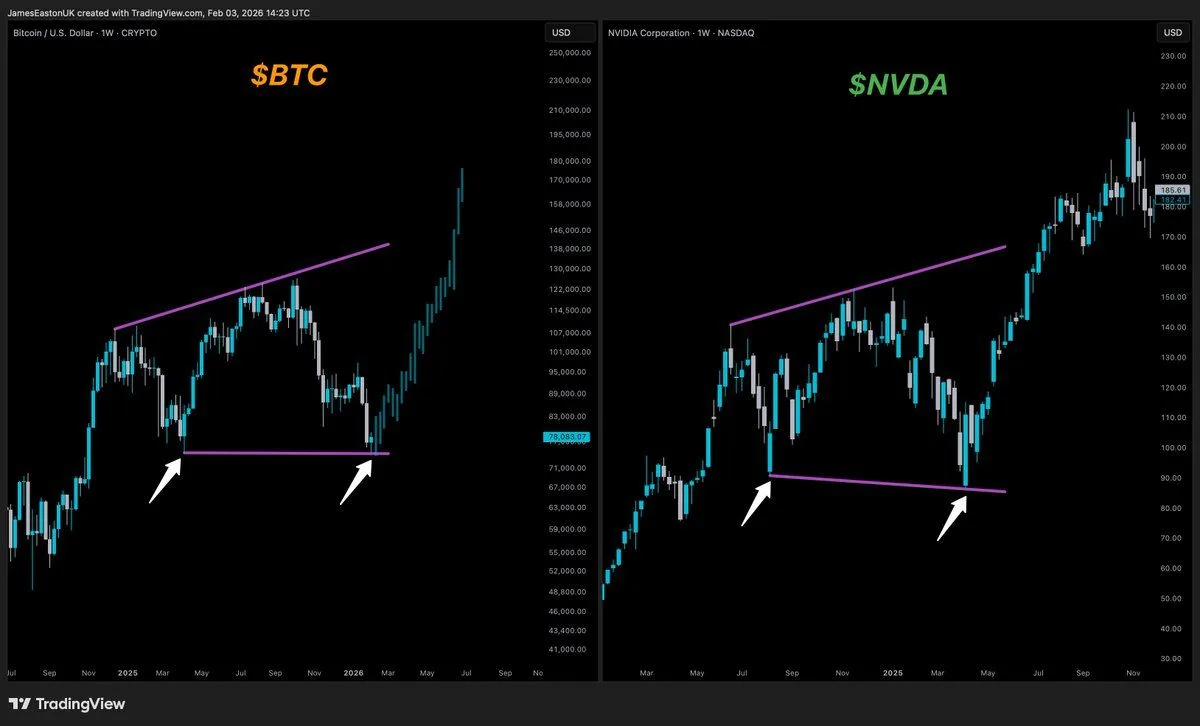
Bitcoin / U.S. Dollar 1W Chart and Nvidia Corporation 1W Chart. Source: JamesEastonUK via X
The side-by-side charts show both assets trading inside a rising channel, then breaking below the lower boundary before snapping back. On the Bitcoin chart, price tested the lower purple trendline twice, marked by white arrows, and then rebounded into a strong recovery leg. On the Nvidia chart, price also dipped below the lower channel line, then reversed higher and later pushed toward the upper boundary.
The comparison focuses on structure, not price level. Both charts highlight the same sequence: rising channel, downside deviation, then reclaim. Still, the setup remains a visual analog, because Bitcoin and Nvidia trade under different drivers, liquidity conditions, and news cycles.
