
Bitcoin hovered near $88,000 as Arthur Hayes pointed to Japan-driven liquidity risk as the potential catalyst, while a long-term chart revived the question of where the next bear market bottom could land.
Hayes links Bitcoin’s next move to possible Fed action in Japan
Arthur Hayes said Bitcoin may stay stuck in a sideways range until fresh dollar liquidity hits markets, and he tied that potential trigger to turmoil in Japan’s currency and government bond markets.
In an essay dated Jan. 28, 2026, Hayes described a “woomph” moment in financial markets after the yen weakened while long-dated Japanese government bond yields rose, a mix he framed as a loss of confidence in Japan’s ability to protect purchasing power and fund deficits cheaply. He argued that higher yields also raise borrowing costs for the Japanese government and deepen paper losses for the Bank of Japan, which holds a large share of JGBs.
Hayes said the United States has an incentive to prevent Japan from becoming a forced seller of U.S. Treasurys. He pointed to Japan’s large overseas asset holdings, including significant Treasury exposure, and said higher JGB yields could pull Japanese money back home. In his view, that would pressure Treasury prices and push U.S. yields higher at a time of large deficits.
He then laid out a scenario in which U.S. authorities intervene through the New York Fed by creating bank reserves, exchanging dollars for yen, and investing yen into assets such as JGBs. Hayes said this would expand the Fed’s balance sheet and show up in the weekly H.4.1 report under “Foreign Currency Denominated Assets.” He framed that balance-sheet growth as the key signal to watch before taking more risk.
On Bitcoin, Hayes said more balance-sheet expansion would mechanically lift Bitcoin in fiat terms, even if the timing does not match short-term traders’ expectations. At the same time, he warned that a fast yen rise often lines up with risk-off behavior as investors unwind yen-funded trades, and he cited past periods when Bitcoin fell as the yen strengthened. He said he would wait for clear evidence of Fed balance-sheet growth before increasing exposure, and he described re-entering leveraged Bitcoin-linked equities if his indicators confirm intervention.
Bitcoin chart maps past bear market floors as price holds near $88,000
Meanwhile, a long-term Bitcoin chart shared by Crypto Caesar on X compares prior cycle peaks and bear market lows while Bitcoin consolidates near $87,900.
The monthly chart highlights three major rallies since 2015, followed by sharp drawdowns and long recovery phases. In the 2017 cycle, Bitcoin peaked near $20,000 and later bottomed around $3,000 in 2018. In the 2020–2021 cycle, it climbed above $64,000 and later fell into the roughly $15,000 to $20,000 area during the 2022 downturn.
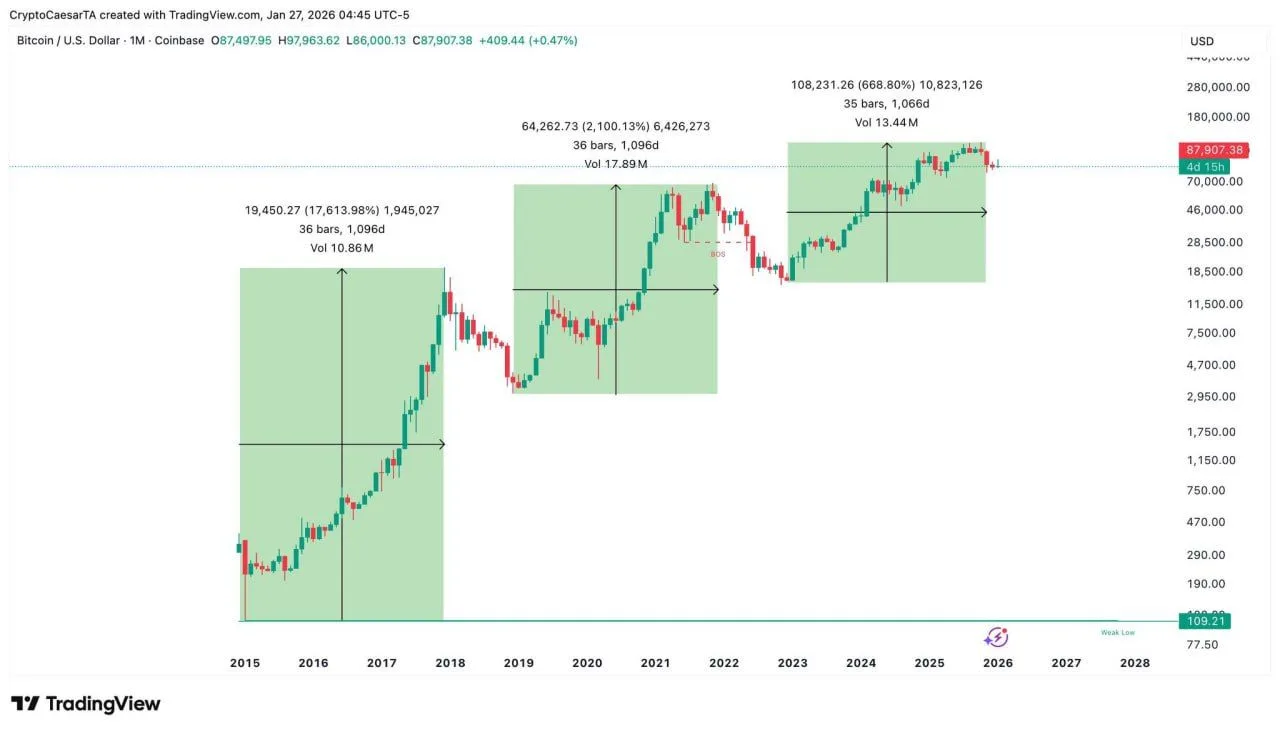
Bitcoin Monthly Cycle Chart. Source: Crypto Caesar on X
Across both cycles, the chart shows bear market lows holding above the previous cycle’s peak. That pattern places the 2021 high zone as a key reference level if the market searches for a deeper floor in a future decline.
At the time of the chart, Bitcoin trades below its recent high above $100,000 but remains well above earlier peak zones. The post does not name a specific bottom, but it frames the debate around whether Bitcoin repeats the same step-up structure seen in earlier cycles.
