
BlackRock moved to expand its Bitcoin lineup by filing for the iShares Bitcoin Premium Income ETF, a product that blends Bitcoin exposure with options based income. Meanwhile, Bitcoin climbed into a key $88,900 resistance zone on the 30 minute chart, setting up a near term decision point for price direction.
BlackRock filed a new Bitcoin ETF that pairs price exposure with options income
BlackRock has filed a registration statement for the iShares Bitcoin Premium Income ETF, a proposed fund that would give investors exposure to Bitcoin while also aiming to generate income through options strategies.
The filing, made with the U.S. Securities and Exchange Commission on Jan. 23, 2026, identifies iShares Delaware Trust Sponsor LLC as the sponsor of the product, according to the Form S 1 cover page.
The fund name signals a “premium income” approach, which typically means collecting option premiums and distributing that income to shareholders. As a result, the ETF could appeal to investors who want Bitcoin exposure but also prefer a yield focused structure rather than a pure spot tracking product.
The filing surfaced as market participants continue to watch how large asset managers expand crypto linked offerings and how demand from traditional investors develops.
Bitcoin tests $88,900 resistance as upside momentum builds
Meanwhile, Bitcoin pushed higher in short term trading and is now pressing into the $88,900 resistance zone, a level highlighted as a key decision area on the 30 minute BTCUSD chart shared by More Crypto Online.
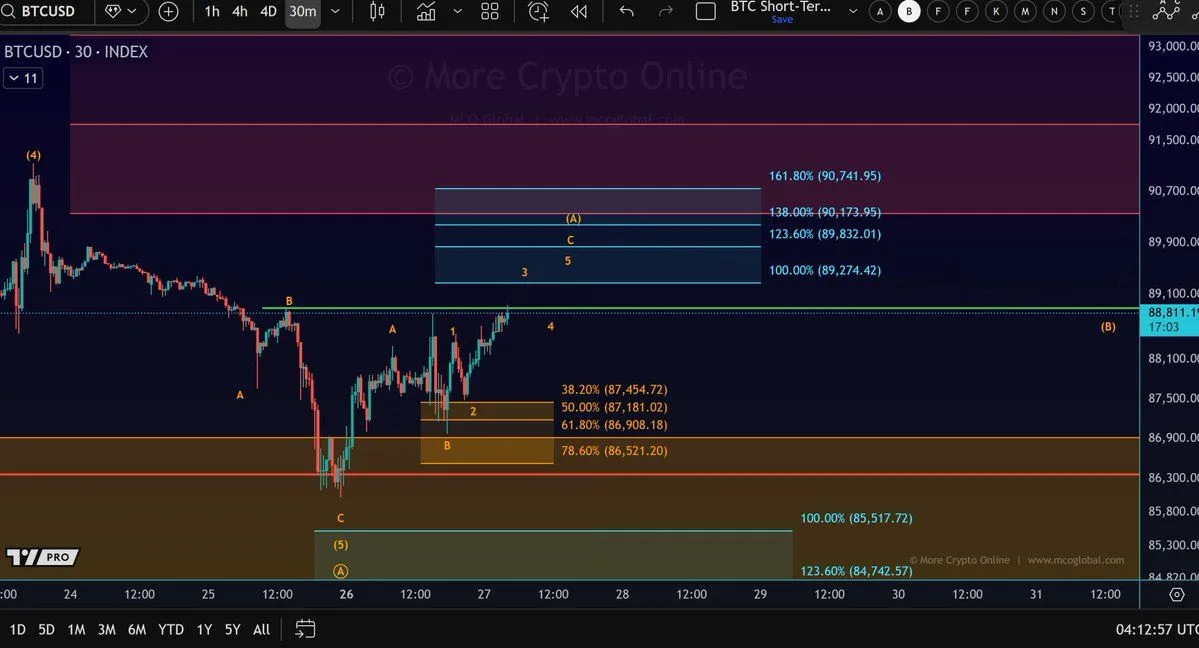
Bitcoin Short Term Resistance Test. Source: More Crypto Online
Price action shows a steady recovery from the recent swing low, with higher lows forming after the bounce from the mid $86,000 area. That move aligns with Fibonacci retracement support between roughly $86,500 and $87,500, where buyers repeatedly stepped in. As a result, momentum shifted back to the upside, driving price toward the current resistance band.
However, the $88,900 level sits near prior structural resistance and a broader range boundary. Because of that, follow through now depends on whether Bitcoin can hold above this zone on a sustained basis. A clean break and hold above $88,900 would likely open the path toward the $89,800 to $90,700 area, where multiple Fibonacci extensions cluster and where selling pressure previously emerged.
If price fails to clear resistance, the chart suggests a short term pullback remains possible. In that case, Bitcoin could rotate back toward the $87,400 to $87,100 region, with deeper support still resting near $86,500. As long as price holds above that lower support band, the structure favors continuation rather than a full trend reversal.
For now, momentum points higher, but the reaction around $88,900 is likely to define the next directional move.
