
Bitcoin is sending mixed on chain signals as older coins move again while demand growth softens. At the same time, accumulation wallets keep adding BTC and price just broke a key daily level near $95,000.
Bitcoin Coin Movement Rises as Apparent Demand Slips
Bitcoin’s on chain data shows more coins moving while a key demand gauge loses momentum, a mix that has often appeared near turning points in past cycles.
A CryptoQuant chart tracking “Apparent Demand Growth” shows the short term, 30 day measure drifting into negative territory in recent readings, even as Bitcoin’s price line stays elevated near recent highs. Meanwhile, the longer, one year apparent demand series has rolled over from its 2024 2025 upswing, which signals slower net absorption compared with earlier phases of the rally.
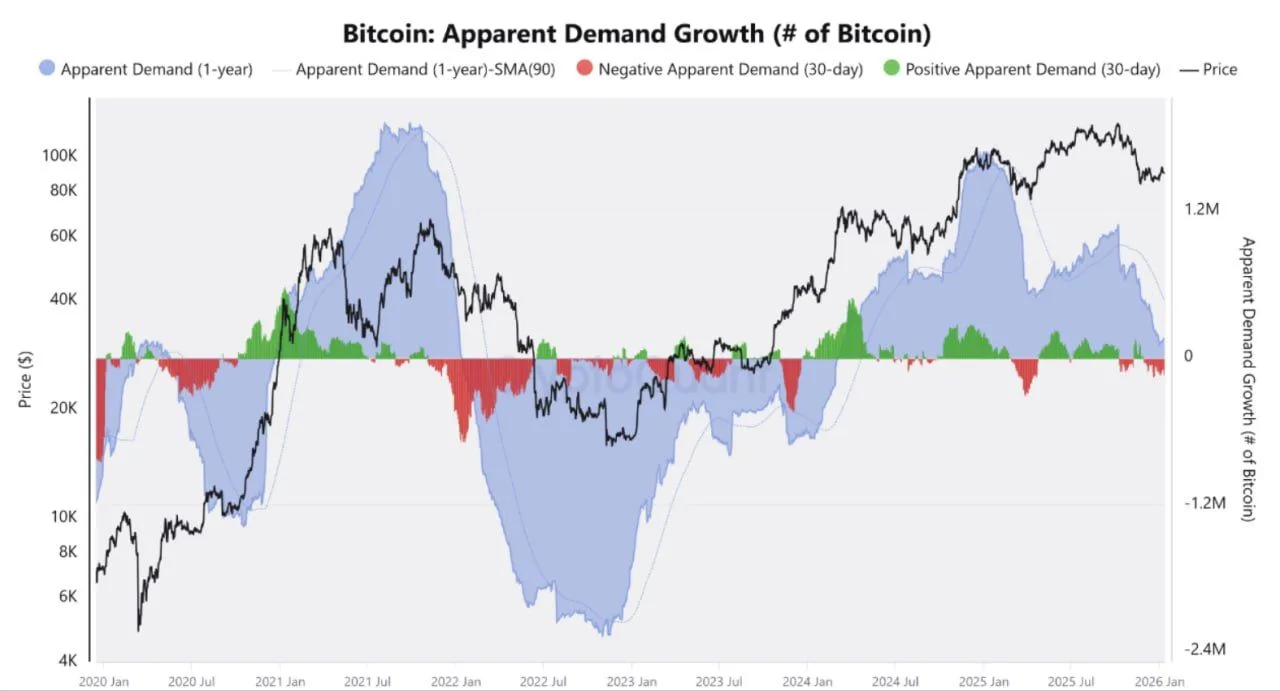
Bitcoin Apparent Demand Growth Over Time. Source: CryptoQuant
CryptoZeno, an on chain analyst, linked the shift to a visible pickup in coin activity across the network. When older unspent outputs start moving in size, it can reflect repositioning by longer term holders rather than quick trading flows. That matters because older cohorts typically sit still during tight supply periods, so a sudden rise in movement can change the market’s supply picture.
If more previously dormant BTC becomes mobile, effective supply can increase through exchange deposits or over the counter redistribution. In that setup, Bitcoin can react more sharply to marginal selling, because the market no longer relies on scarcity alone to support price. Past cycles also showed that demand weakness alongside steady price action often preceded wider daily ranges, as traders adjusted to the gap between price resilience and softer net buying pressure.
The signal does not set a direction by itself. Still, the combination of higher coin mobility and cooling apparent demand suggests a market that may depend more on confidence driven flows than on expanding organic demand, which can make conditions more fragile if the pattern persists.
Accumulating Bitcoin Addresses Grow Holdings
Meanwhile, Bitcoin on chain data shows accumulation addresses expanding holdings over the past three years, even as price moved through repeated swings.
CryptoQuant data shows accumulation addresses hold about 2.4 million BTC, valued near $218 billion at current prices. During the 2022 bear market lows, the same cohort held about 540,000 BTC, worth roughly $8 billion at the time.
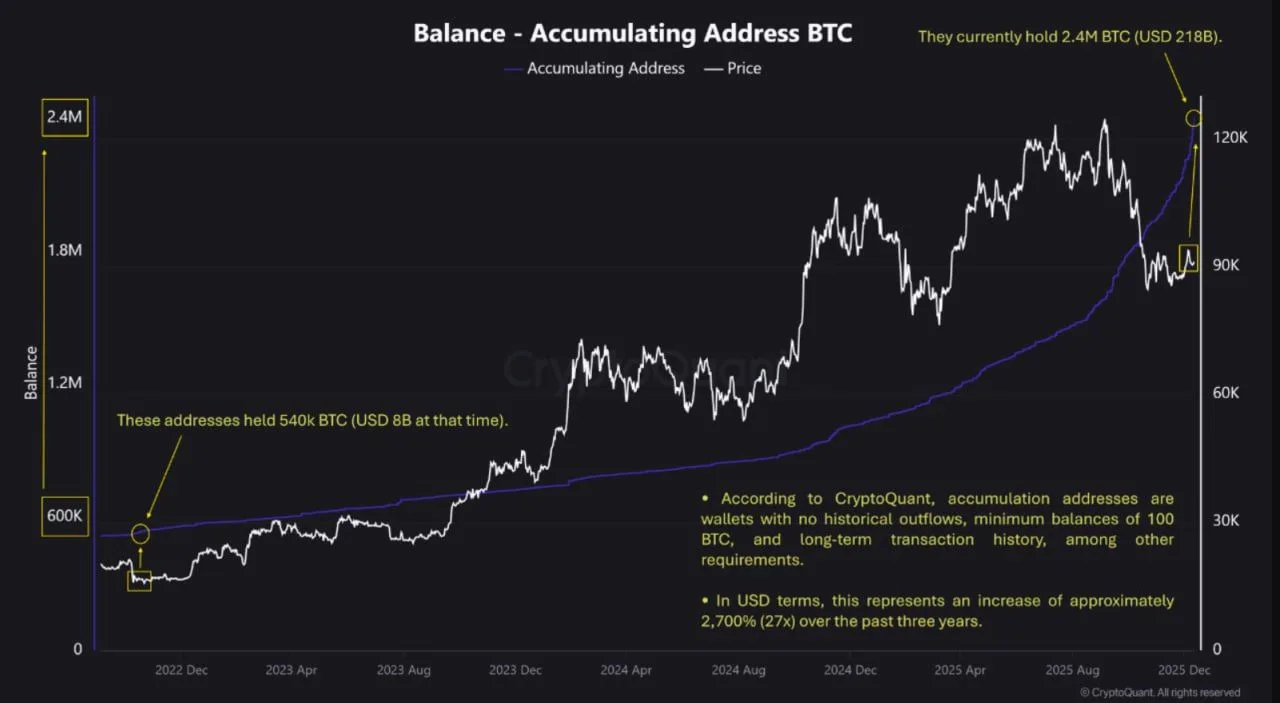
Accumulating Address Bitcoin Balance. Source: CryptoQuant
CryptoQuant defines accumulation addresses as wallets with no historical outflows, balances of at least 100 BTC, and long transaction histories. Because these wallets do not send coins out, balance growth tends to reflect longer term positioning rather than active trading.
The chart shows a gradual climb in holdings through 2023, followed by faster growth during 2024 and 2025, despite pullbacks in price. In dollar terms, the increase equals about 2,700% over three years, while the BTC count also rose sharply. As more supply moves into wallets that historically remain inactive, available liquidity can tighten, which can amplify moves when selling pressure increases.
Bitcoin Breakout Puts Focus on $100,000 Level
Bitcoin pushed above a key horizontal level on the daily BTCUSDT chart, as an analyst said the move fits a classic breakout setup that could keep pressure on the $100,000 area.
A TradingView chart shared by Ted Pillows shows Bitcoin breaking above a prior ceiling near the mid $90,000s after weeks of choppy trading. The move followed a series of higher lows that leaned against a rising support trendline, while price repeatedly tested the same resistance band.
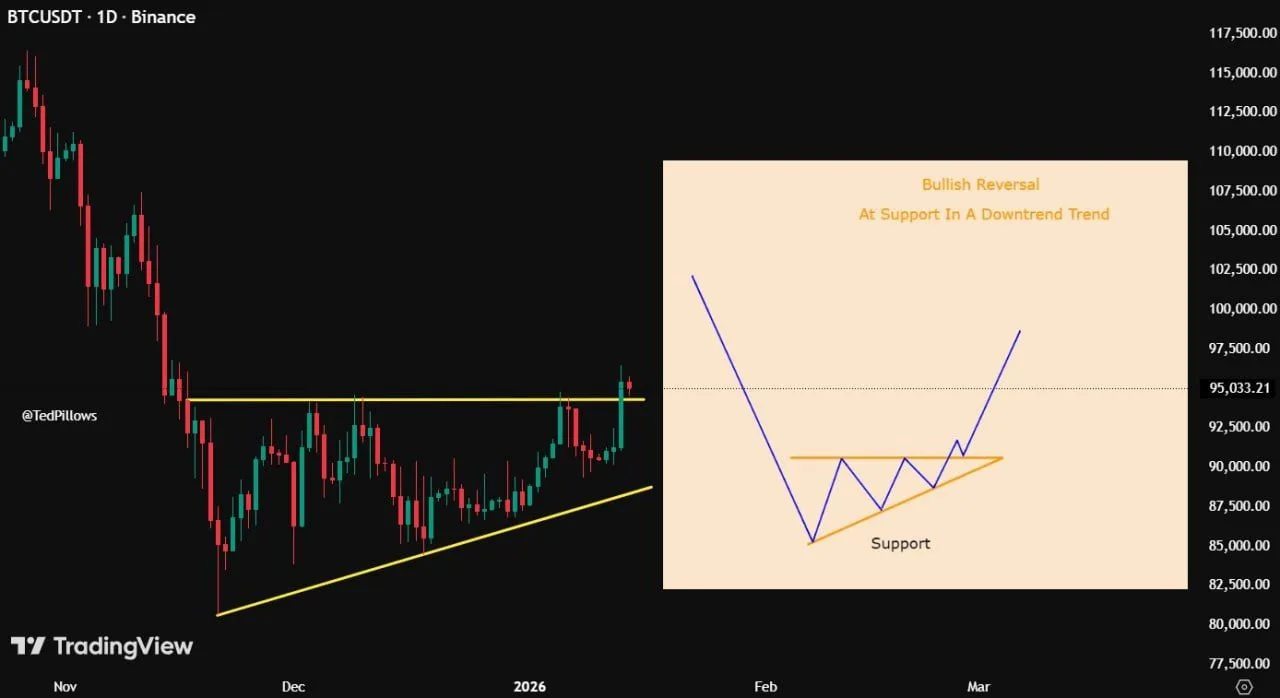
Bitcoin BTCUSDT Daily Chart. Source: TedPillows (X)
The chart places the latest price near $95,033 on Binance. That leaves the breakout level as the near term line that traders often watch for confirmation. If price holds above that former resistance, the setup shifts from range trading to trend continuation attempts, with the next major psychological level sitting at $100,000.
Ted Pillows wrote that Bitcoin needs to “hold the breakout trendline,” adding that $100,000 “could happen this month.” The chart also includes a schematic showing a bullish reversal pattern forming at support inside a broader downtrend structure, which frames the current rally as a rebound that still needs follow through to prove strength.
