
Solana entered mid-January under renewed market focus as exchange-traded fund flows, whale activity, and long-term chart structures converged. Although SOL declined modestly on the day, broader positioning suggested a market preparing for expansion rather than exhaustion. Investors continued tracking ETF data, on-chain movements, and multi-year technical patterns for direction.
ETF Flows and Market Context
U.S. digital asset ETFs sent mixed signals on January 9, according to SoSoValue data. Bitcoin spot ETFs posted net outflows totaling $250 million during the session. Fidelity’s FBTC stood out by recording a $7.87 million inflow, the strongest among Bitcoin funds. Meanwhile, Ethereum spot ETFs reported $93.82 million in net outflows.
However, Solana spot ETFs recorded no net flows, holding steady despite broader risk adjustments. Significantly, Solana ETFs have remained net positive since December 4, 2025. Hence, the lack of outflows reinforced perceptions of structural confidence rather than fading demand.
Source: CoinCodex
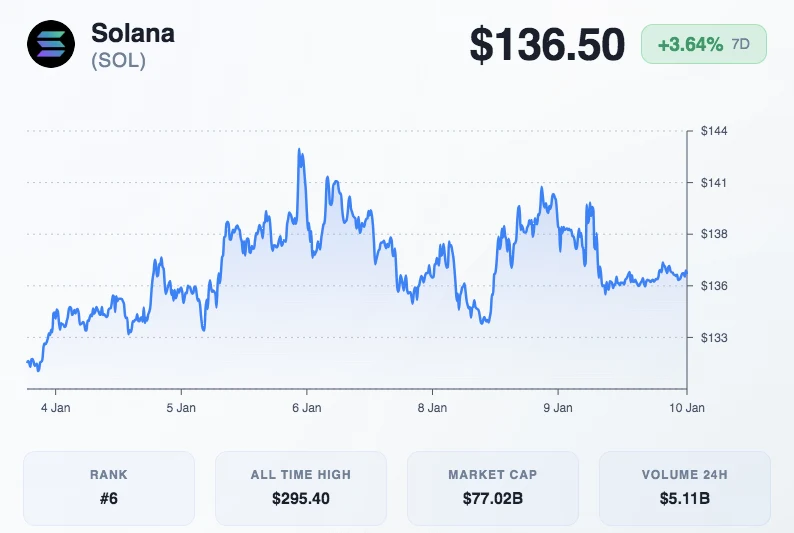
At the time of writing, Solana traded at near $136, reflecting a 2.21% daily decline. However, SOL still posted a 3.51% gain over the past week. Trading volume reached nearly $2.85 billion, while market capitalization stood near $76.9 billion.
Technical Structure Signals Expansion
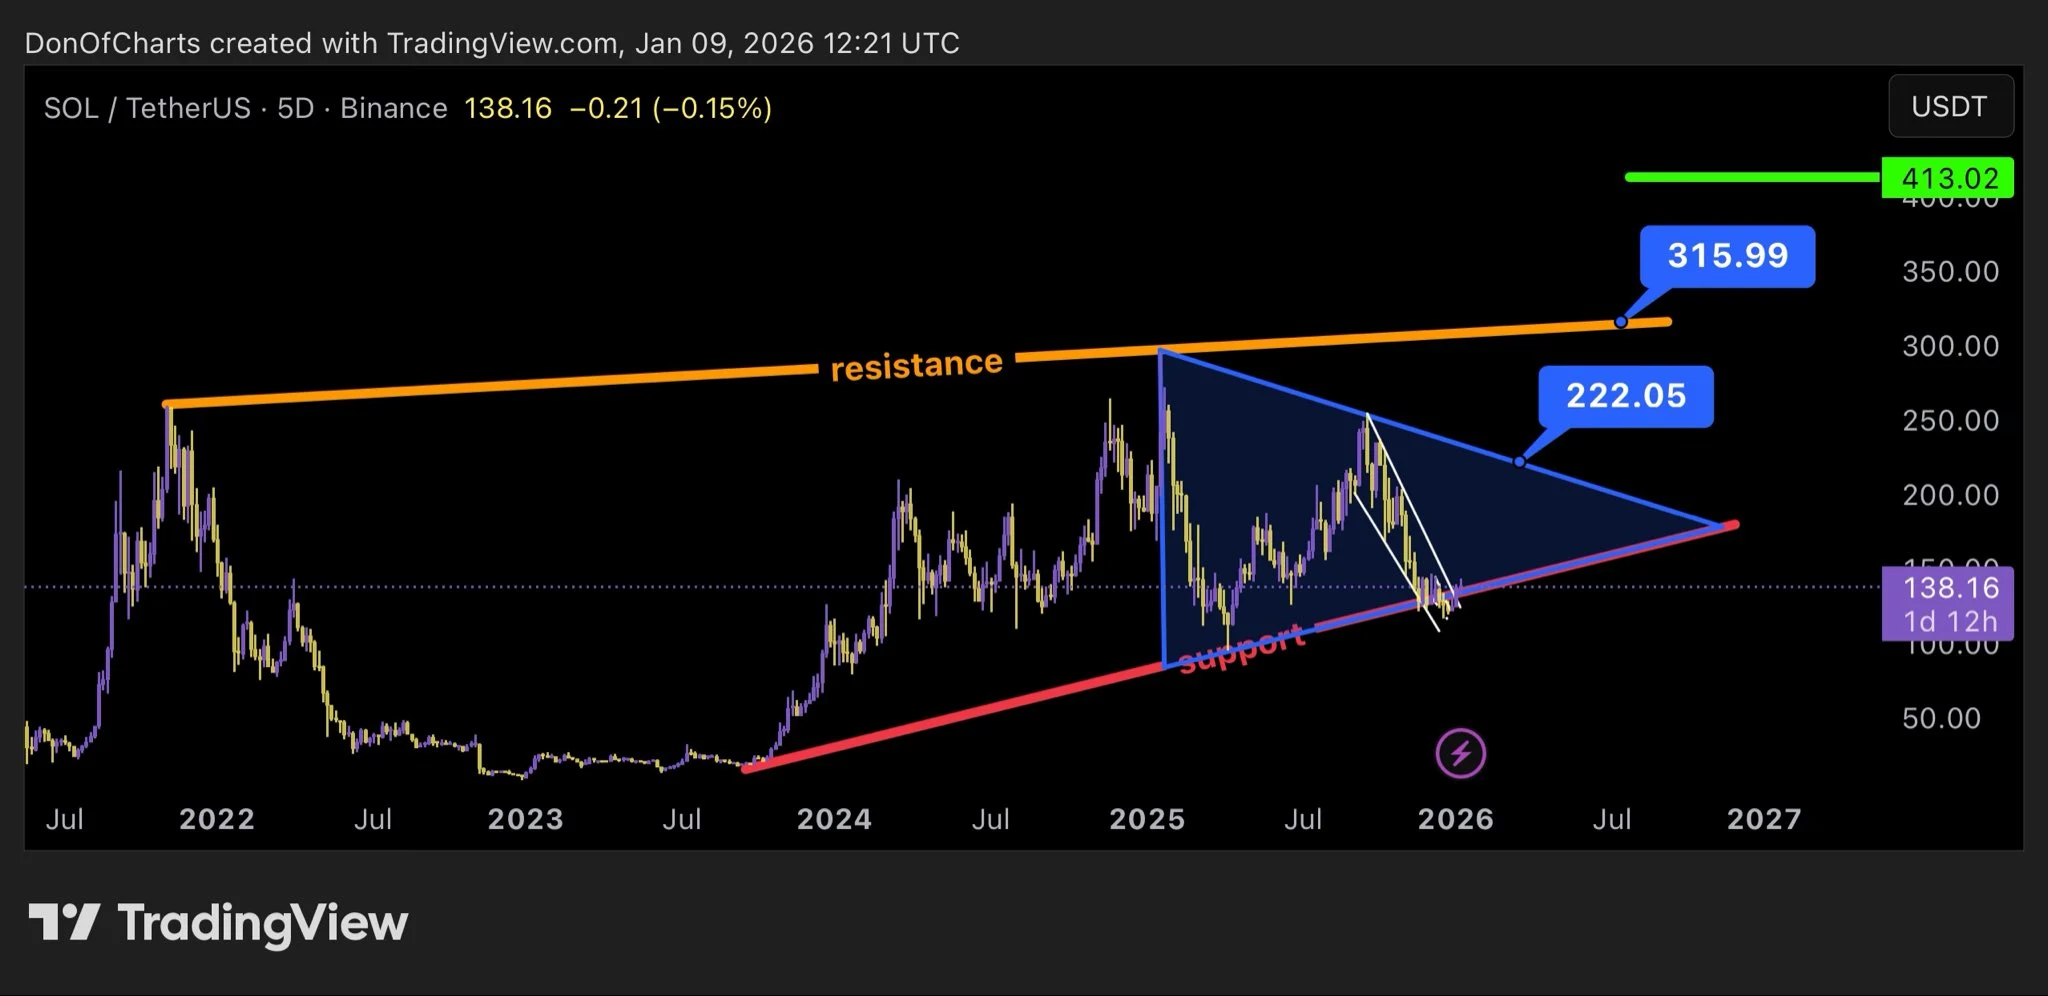
Market analysts continued highlighting Solana’s long-term chart setup. Don pointed to a tightening wedge forming after a multi-year base. Additionally, rising support between $120 and $140 continued holding despite recent volatility.
According to Don, a clean reclaim of $222 would flip momentum and unlock the upper channel. Acceptance above $315 would confirm trend continuation toward $413, a previous macro resistance level. Consequently, a breakout beyond $413 could trigger price discovery, driven by compressed volatility and higher lows.
Source: X
Measured-move projections suggested acceleration once that resistance breaks. Hence, Don outlined a pathway from $222 to $315, then $413, before extending toward $1,000 ahead of mid-year.
On-Chain Signals Reinforce Bullish Bias
Analyst commentary from curb.sol echoed the technical optimism. The analyst noted repeated higher lows forming in the $130 range. Moreover, curb.sol argued that a decisive move above $200 could rapidly shift market psychology.
According to that analysis, clearing $1,000 would attract mainstream attention and retail participation. Wealth management exposure could follow, accelerating momentum toward higher targets.
On-chain data added another layer of confirmation. Lookonchain reported that wallet 7Z4KKD withdrew 80,000 SOL, valued at $10.87 million, from Binance. The wallet remained dormant for nearly a year before the transaction.
