
Shiba Inu has regained bullish traction after holding a critical weekly support zone, prompting fresh upside projections from market analysts. Recent price action signals a strengthening of momentum following a rebound in late 2025. At the time of writing, SHIB trades at around $0.00000886 after a modest 0.02% gain in the last 24 hours.
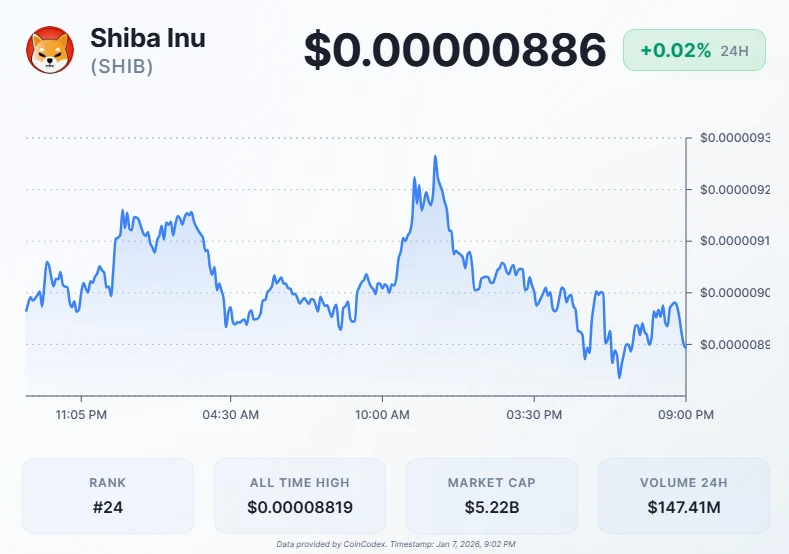
SHIB’s price action over the 24 hours (Source: CoinCodex)
The setup now places the meme coin at a decisive technical point as traders monitor resistance and volume trends. Analysts say the structure favors continuation if buying pressure remains steady.
Analyst outlines key support, resistance, and multi-year upside targets
MMB Trader reported that Shiba Inu showed strong demand after revisiting the $0.0000060 weekly support during the closing weeks of 2025. He noted that SHIB bottomed at $0.0000068 on December 31, respecting the same level that held throughout the Q4 downtrend that began in October. According to the analyst, this move validated an earlier forecast in which he urged entries near weekly support. He said the subsequent 32% rebound to around $0.0000090 confirmed a solid base for further upside.
MMB Trader identified a resistance zone between $0.0000104 and $0.0000110 as the next hurdle, stating that a breakout would likely push SHIB toward the first target of $0.00001366, representing a 51.7% gain from current levels. He added that rising buying volume could extend the rally toward higher timeframe resistance, projecting a move to $0.00003364, a multi-month high last seen in December 2024, implying a 273% increase.
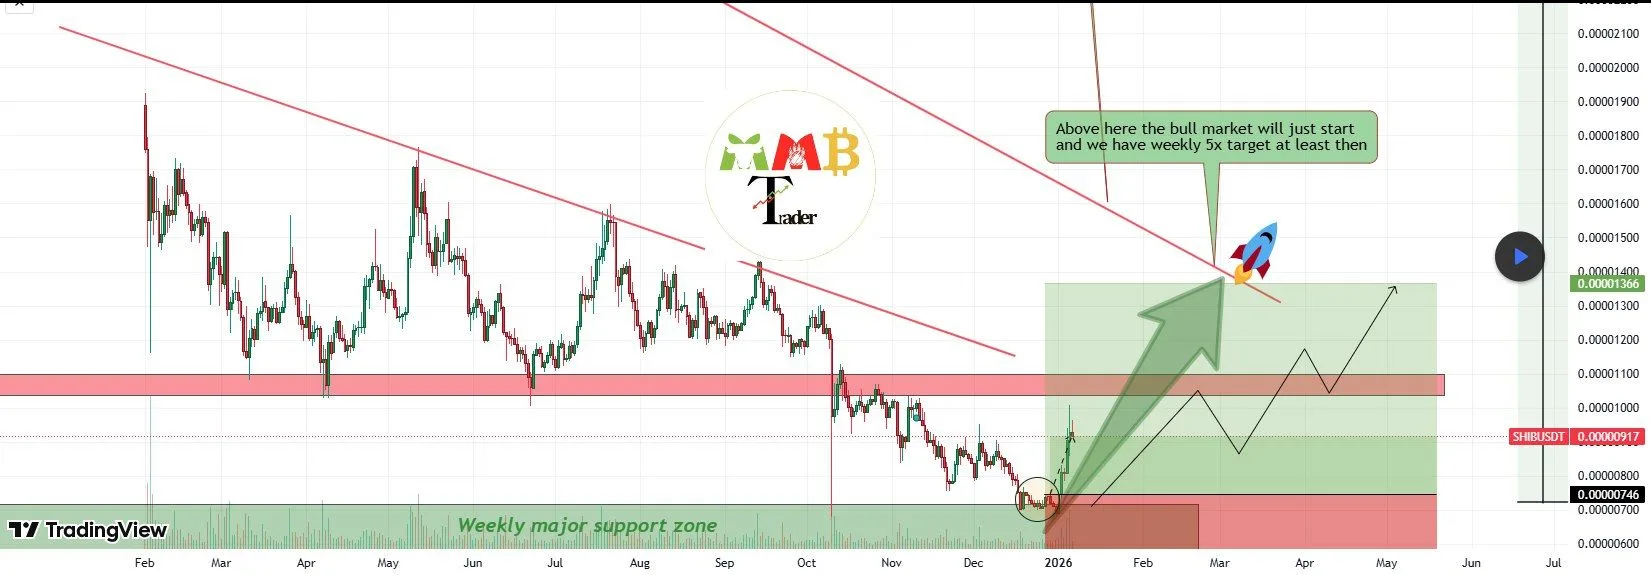
SHIB price chart, Source: TradingView
Beyond that, he outlined further upside potential to $0.4753, a 428% rise, before a possible advance to a multi-year high of $0.00007730. He noted that SHIB last traded near that level in October 2021, close to its all-time high of $0.00008854, and emphasized that sustained volume growth would be key to maintaining the uptrend.
Shiba Inu Trades Below Key Resistance
On the weekly chart, Shiba Inu remains in a broader consolidation-to-downtrend phase after failing to sustain its 2024 rally highs. Price is currently trading below key weekly resistance around $0.0000100–$0.0000105, a zone that has repeatedly capped upside attempts.
Immediate support is holding near $0.0000080, with a more critical long-term demand area around $0.000007, which previously triggered strong rebounds. As long as SHIB stays below the $0.0000100 region, the structure favors range-bound or mildly bearish continuation, while a clean break above that resistance would be needed to shift the weekly trend bullish.
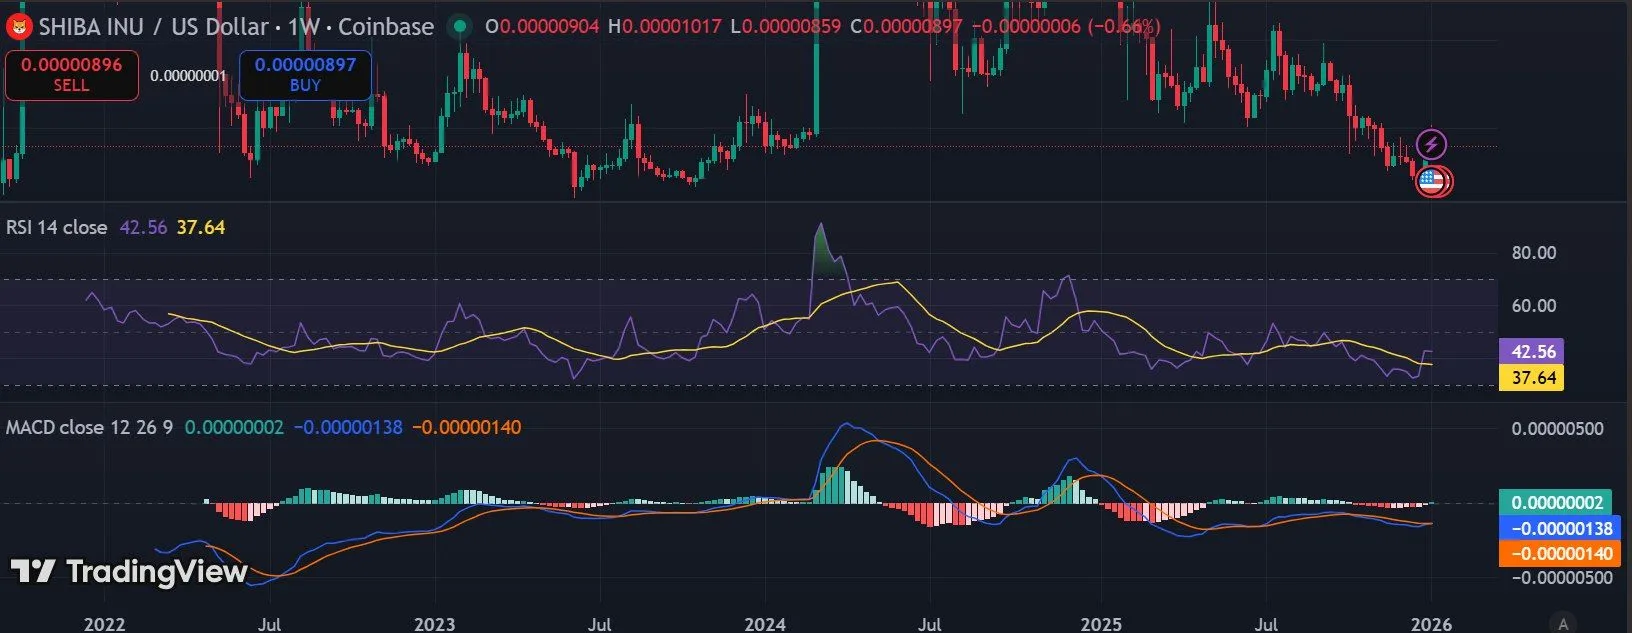
SHIB Weekly chart, Source: TradingView
The RSI (14) sits around the low 40s, signaling weak momentum and limited buying strength, although not yet deeply oversold. The RSI moving average is trending slightly downward, which reinforces the lack of bullish conviction. Meanwhile, the MACD remains marginally negative, with the MACD line below the signal line and a flat-to-weak histogram, suggesting bearish momentum is present but not accelerating aggressively.
