
In This Article
ArcBlock ($ABT) trades near $0.28, down over 83% year-on-year. The broader crypto market remains under pressure, and small-cap infrastructure tokens feel the impact first. Yet deep drawdowns often spark questions. Has ABT reached a long-term value zone? Or does downside risk still dominate?
ArcBlock launched in 2018 with a bold goal. It aimed to create a unified blockchain ecosystem that connects multiple chains through an open access layer. The vision targeted third-generation decentralized applications. Years later, the market tests that vision under harsh conditions.
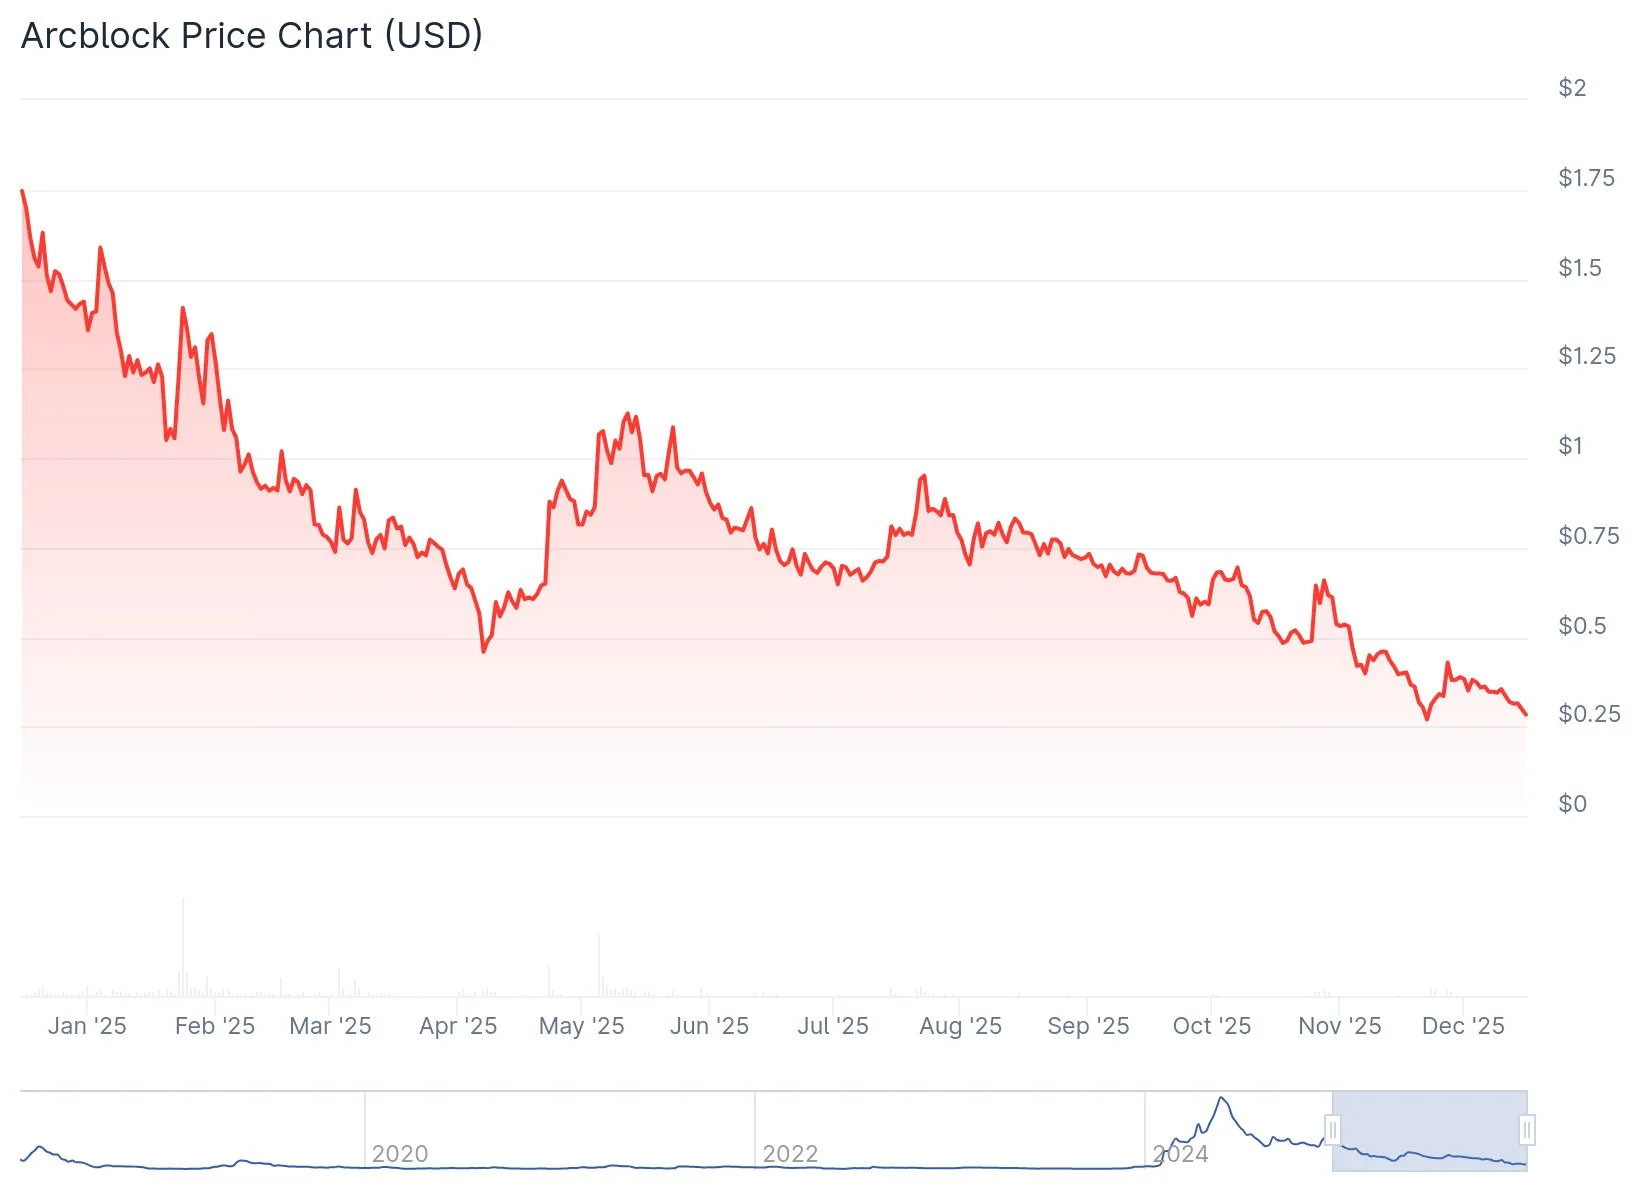
Source: Coingecko
ArcBlock Fundamentals Still Matter
ArcBlock focuses on interoperability. It builds tools that allow developers to deploy DApps across multiple blockchains. That problem still exists. Ethereum, Cosmos, and newer chains continue to fragment liquidity and users.
Key fundamentals include:
Open Chain Access Protocol for cross-chain connectivity
Blocklet architecture for modular DApp development
Ethereum ecosystem compatibility
The challenge? Execution and adoption. Many newer protocols now compete for the same space. Can ArcBlock stand out again?
ABT Technical Structure and Market Behavior
ABT trades below both its 50-day and 200-day SMAs, and that confirms bearish structure. Momentum indicators, though, hint at exhaustion.
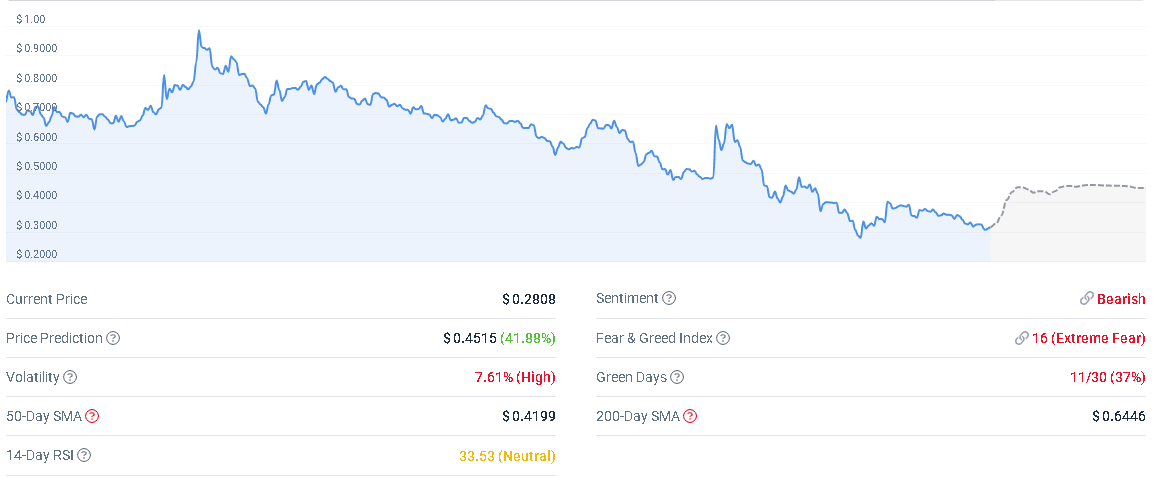
Source: X
RSI sits near 33, close to oversold territory. Selling pressure has slowed near historical support zones.
Important levels to watch:
Support: $0.27, then $0.24
Resistance: $0.33, followed by $0.36
If buyers defend support, short-term stabilization may follow. A breakdown opens risk toward lower historical demand zones.
ArcBlock Price Prediction 2025
The remaining period of 2025 looks defensive. Market sentiment stays cautious, and liquidity remains thin. ABT may trade in a tight range unless broader market conditions improve.
Expectations center on consolidation rather than breakout. Can ABT hold above $0.25? That question matters most for near-term survival.
ArcBlock Price Prediction 2026
2026 shifts focus toward recovery potential. Crypto cycles historically rotate after extended bear phases. If infrastructure narratives return, ArcBlock may benefit.
A move toward the $0.45–$0.46 zone becomes possible if:
Developer activity improves
Interoperability demand grows
Risk appetite returns to small caps
Failure to attract builders limits upside.
ArcBlock Price Prediction 2030
Long-term forecasts assume renewed relevance. By 2030, blockchain ecosystems may demand stronger cross-chain coordination. ArcBlock’s original thesis fits that future.
Upside targets stretch toward $2.49 in optimistic scenarios. That requires:
Sustained ecosystem usage
Clear differentiation from rivals
Long-term product execution
ArcBlock Price Prediction 2050
2050 forecasts depend on survival. Many tokens fade before then. If ArcBlock endures and adapts, value could compound over decades.
A mature Web3 infrastructure role could push ABT into multi-dollar territory. Failure to evolve ends the story much earlier.
ArcBlock ($ABT) Price Prediction Table
| Year | Min | Avg | Max |
| 2025 | $0.24 | $0.32 | $0.45 |
| 2026 | $0.32 | $0.39 | $0.46 |
| 2030 | $0.89 | $1.65 | $2.49 |
| 2050 | $3.50 | $6.80 | $10.50 |
Conclusion
ArcBlock trades at a critical crossroads. Price action reflects deep pessimism, yet long-term infrastructure themes still support its original vision. Short-term risk remains high, and bearish momentum dominates 2025. Recovery depends on adoption, execution, and renewed interest in cross-chain solutions.
For patient investors, ABT offers asymmetric upside tied to long-term Web3 infrastructure growth. For traders, discipline matters. Support zones must hold. Without renewed ecosystem traction, price recovery remains speculative. ArcBlock’s future now depends less on vision and more on execution.
