
Bitcoin traders circulated two competing signals on X as a Bank of Japan rate hike narrative resurfaced while order books showed heavy demand below spot. One post linked prior BoJ hikes to 20% plus BTC pullbacks, while another showed stacked bids around $88,000 to $90,000 and lighter sell pressure until $93,500.
Japan Rate Hike Claim Tied to Bitcoin Selloffs
Market commentary circulated on X after trader AndrewBTC said a Bank of Japan rate hike could trigger another sharp Bitcoin decline. In a Dec. 13 post, he wrote that the Bank of Japan is set to raise rates by 25 basis points, adding that Japan remains the largest holder of U.S. government debt. He argued that tighter Japanese monetary policy has coincided with large Bitcoin pullbacks in recent cycles.
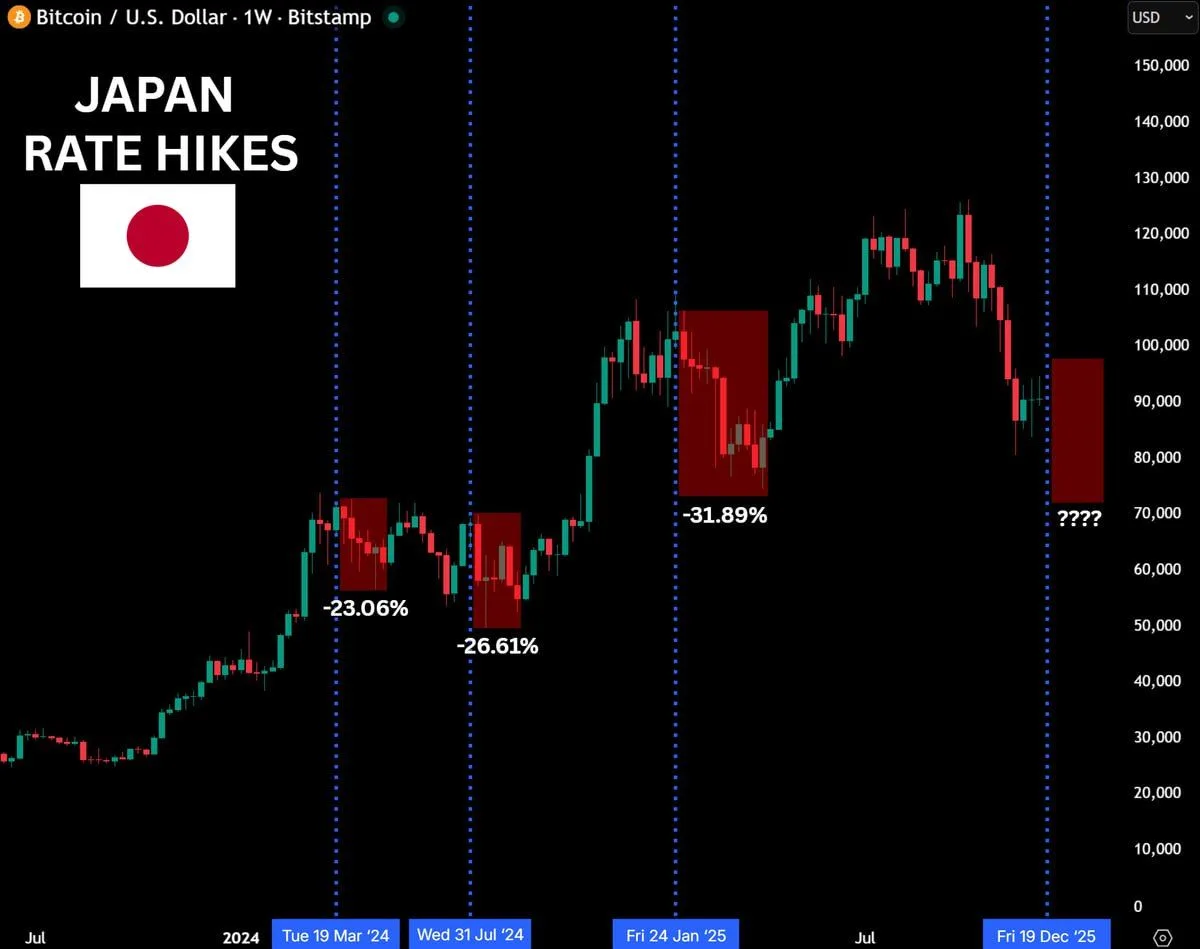
Bitcoin Weekly Price Reaction to Japan Rate Hikes. Source: AndrewBTC via X
The claim pointed to past rate hikes and subsequent Bitcoin moves. In March 2024, Bitcoin fell about 23% after a Bank of Japan decision, according to the chart shared in the post. In July 2024, another hike preceded a drop of roughly 26%. In January 2025, Bitcoin later declined close to 31%, based on the same visual analysis.
The chart highlighted each rate hike with vertical markers and showed red price ranges following the decisions. AndrewBTC said the pattern suggests a repeat could follow if the Bank of Japan moves again in December. The post framed the rate hike as “loading” another downside move, though it did not include official confirmation from the central bank.
The Bank of Japan has gradually shifted away from ultra loose policy after years of near zero rates and yield curve control. Those changes have drawn attention across global markets, including equities, bonds, and digital assets. However, the post did not provide causal evidence beyond historical price comparisons.
Bitcoin was trading well below its recent highs at the time the post circulated. Market participants continued to debate whether macro policy decisions, including moves by the Bank of Japan, directly drive crypto price action or simply coincide with broader risk off periods.
Bitcoin Order Book Shows Heavy Bids Near $88K–$90K
Market data shared by trader Ted Pillows showed dense buy orders clustered below Bitcoin’s current price, suggesting strong demand in the $88,000 to $90,000 range. The snapshot, posted on X, highlighted stacked bids across major exchanges, including Binance, Bitfinex, and Kraken, based on visible order book depth.
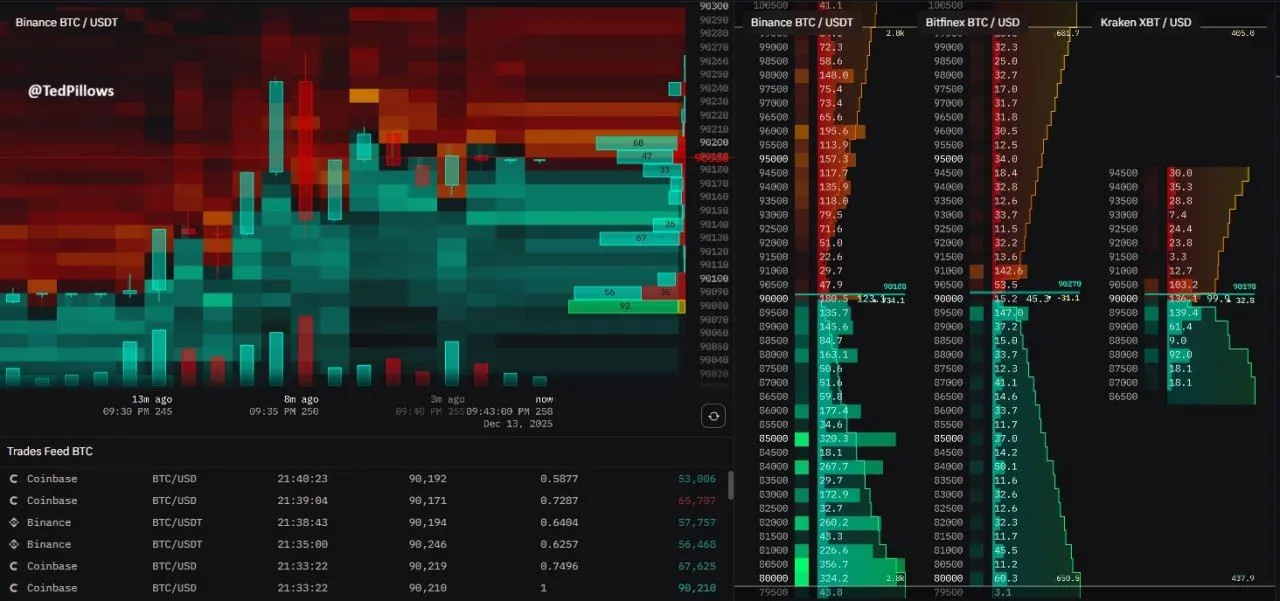
Bitcoin Order Book Liquidity Heatmap. Source: Ted Pillows via X
The chart showed green liquidity blocks building on the downside, indicating buyers positioned to absorb selling pressure if price drifts lower. According to the visual data, the $90,000 area stood out as a key support zone, with cumulative bids increasing sharply as price moved toward $88,000.
On the upside, the same order book data suggested lighter resistance until higher levels. Ted Pillows noted that selling pressure appeared limited until Bitcoin approaches the $93,500 area. The heatmap showed thinner red liquidity above the market compared with the dense bid zones below.
Order book positioning often reflects short-term trader intent rather than long-term direction. Still, the imbalance between downside bids and overhead offers pointed to a market structure where buyers currently dominate near support, while sellers remain sparse until higher price levels are tested.
