
Bitcoin’s policy backdrop is shifting as Senator Cynthia Lummis presses to move a U.S. crypto market structure bill through the Senate within weeks. At the same time, Bitcoin price action continues to react to Federal Reserve meetings and now hovers near the average cost basis of spot ETF buyers.
Lummis Says Crypto Market Structure Bill Could Move Within Weeks
Senator Cynthia Lummis says the long-awaited U.S. crypto market structure bill could advance within weeks as Senate negotiators finalize the latest draft. She discussed the timeline during recent policy meetings in Washington, noting that the Banking Committee is close to completing the text after months of revisions.
Lummis and Senator Kirsten Gillibrand are leading the effort to create a federal framework that defines when a digital asset falls under SEC or CFTC oversight, sets licensing standards for trading platforms and custodians, and introduces clearer rules for market conduct. They aim to align their bill with the House’s earlier market-structure package, which already passed its first chamber.
Despite her optimism, the bill still must clear committee markup, move through the full Senate and then be reconciled with the House version. Negotiators are also working through remaining points with the White House. Lummis said the final text is nearly ready, but progress depends on how quickly leadership schedules the next steps.
Bitcoin Has Mostly Dropped After This Year’s Fed Meetings
Bitcoin has usually moved lower after Federal Reserve policy decisions this year, according to data compiled by analyst Ali Martinez. The chart compares the seven 2025 Federal Open Market Committee meetings with subsequent price action and shows that six were followed by clear corrections in the BTC/USDT pair, while only one produced a short-lived bounce.
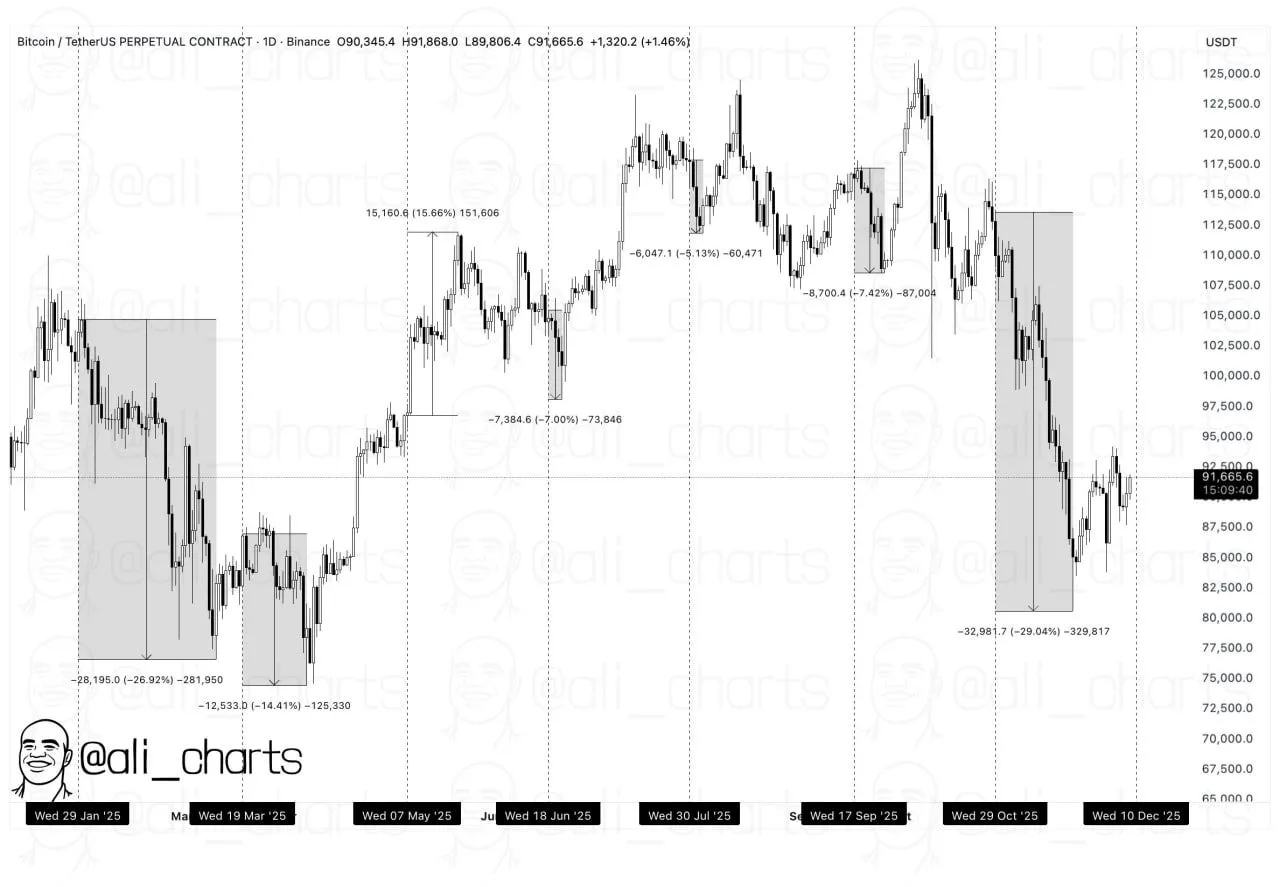
Bitcoin Price Reactions After 2025 FOMC Meetings: Source: Ali, @ali_charts
On the image, shaded boxes mark the trading windows that followed each FOMC announcement. After the late-January meeting, Bitcoin fell roughly 27 percent, while the March decision preceded another slide of about 14 percent. A smaller pullback of around 7 percent followed the June meeting, and the most recent decision in late October lined up with the steepest drop on the chart, a decline of about 29 percent from the local high.
The lone exception came in early May, when Bitcoin briefly rallied more than 15 percent before giving back part of the move. Taken together, the sequences underline how closely Bitcoin has traded with shifting expectations for U.S. interest rates this year, with Fed days often acting as turning points that usher in fresh volatility and downside pressure.
Bitcoin Tests ETF Cost Basis as Support
Meanwhile, Bitcoin has pulled back to the area where U.S. spot ETFs hold their average purchase price, according to data shared by analyst Crypto Rover using Glassnode figures. The chart plots BTC’s dollar price against the cost basis of major issuers, including BlackRock, Fidelity and Grayscale, as well as a combined “all ETFs” line.
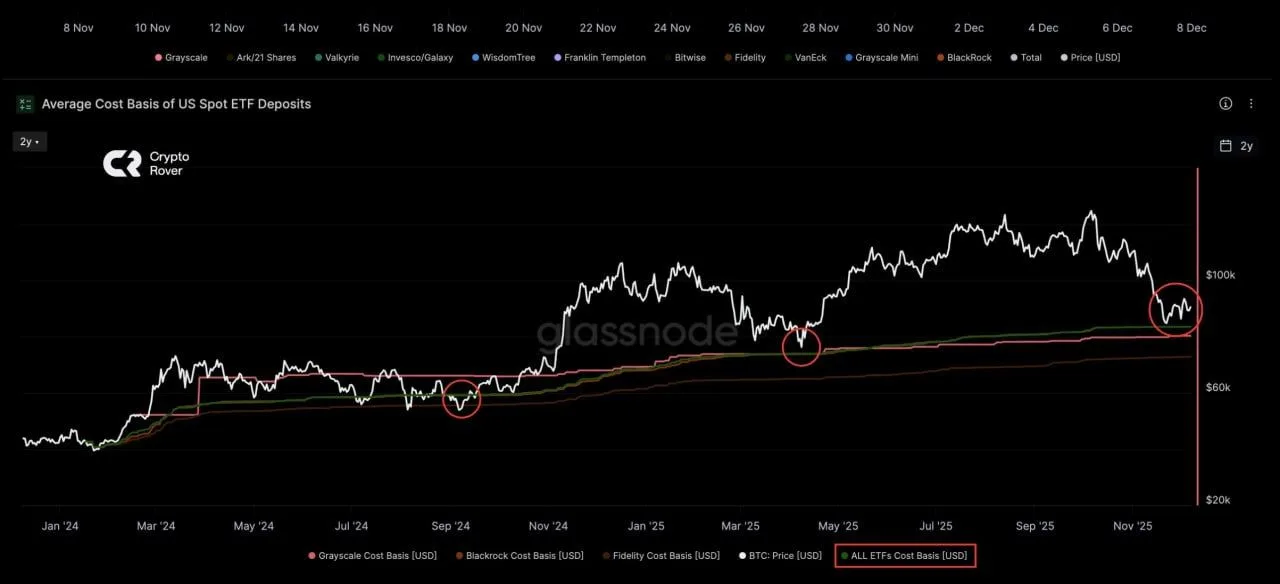
Average Cost Basis of US Spot Bitcoin ETF Deposits: Source: Crypto Rover, Glassnode
The white price line shows several earlier dips in 2024 and mid-2025 that briefly undercut or met the green “all ETFs cost basis” line before Bitcoin rebounded. The latest circled move at the right edge of the chart again brings BTC down toward that aggregate entry level, while ETF cost bases remain clustered below spot, indicating the cohort is still sitting on unrealized gains.
Because of this, traders now watch the ETF cost-basis region as a potential support zone. If Bitcoin continues to respect that band, it would suggest that large ETF buyers are not yet deeply under water, even after the recent correction.
