
Dogecoin started at $0.1368 and saw a sharp surge, quickly rising above $0.145. After the spike, the price stabilized with moderate fluctuations between $0.145 and $0.149. DOGE remains under pressure on higher timeframes, sitting about 7.3% lower over the past week and 12.3% down in the last 14 days. This suggests that today’s move is more of a relief rally within a broader cooling-off phase. As of this writing, the DOGE is exchanging hands at around $0.1500 with a 24-hour gain of 9.5%.
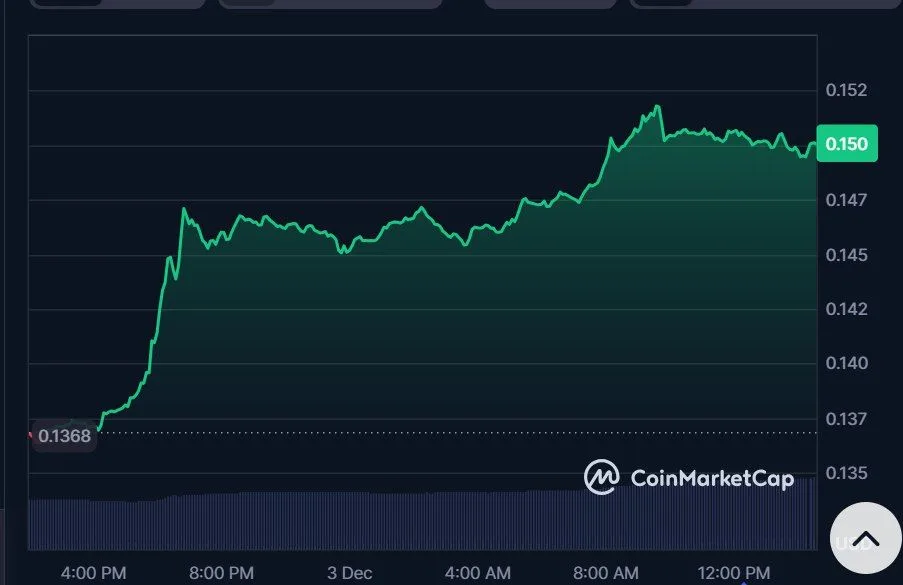
Dogecoin price chart, Source: CoinMarketCap
Dogecoin Forms Dragonfly Doji, Signaling Potential Bullish Reversal
According to analyst Trader Tardigrade, Dogecoin is currently showing signs of a potential bullish reversal on the weekly chart. The key signal highlighted is the Dragonfly Doji, a classic candlestick pattern that often indicates a shift from a downtrend to an uptrend. This pattern appears when the price opens, drops significantly, but then recovers to close near the opening price, leaving a long lower shadow.
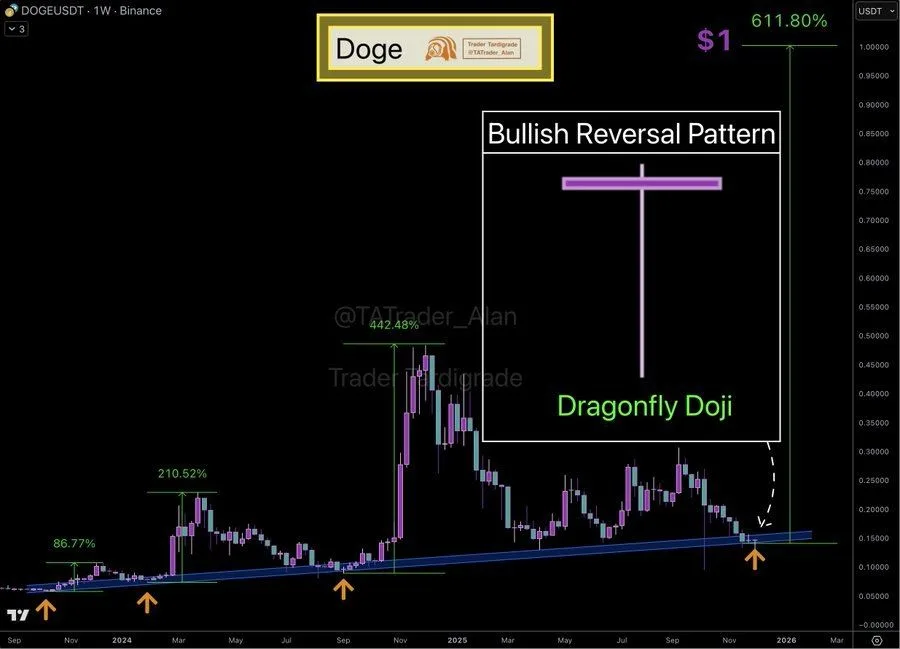
Source: X
In Dogecoin’s case, the Dragonfly Doji has formed at a strong trendline support, which has historically acted as a solid foundation during previous price rallies, as seen in past surges of 86%, 210%, and even 442% within 2024–2025. This suggests that buyers are stepping in to defend key levels, creating the potential for a strong upside move.
Trader Tardigrade further notes that if the bullish reversal holds, Dogecoin could target $1, representing a potential gain of over 600% from current levels. The analyst emphasizes that the weekly chart’s long-term perspective strengthens the significance of this reversal signal, making it more reliable than shorter-term patterns. Past instances of trendline support combined with bullish reversal signals have historically led to substantial price appreciation, suggesting DOGE may be entering another major upward cycle.
Dogecoin Technical Analysis
Dogecoin’s price on the 1-day timeframe shows the price stabilizing after a prolonged downtrend, with the market attempting to hold above the $0.1450–$0.1500 zone. This area has acted as a short-term base after recent weakness. Key support sits around $0.1450, while resistance is forming near $0.1600, with a stronger ceiling around $0.1700 that DOGE would need to break to confirm bullish momentum.
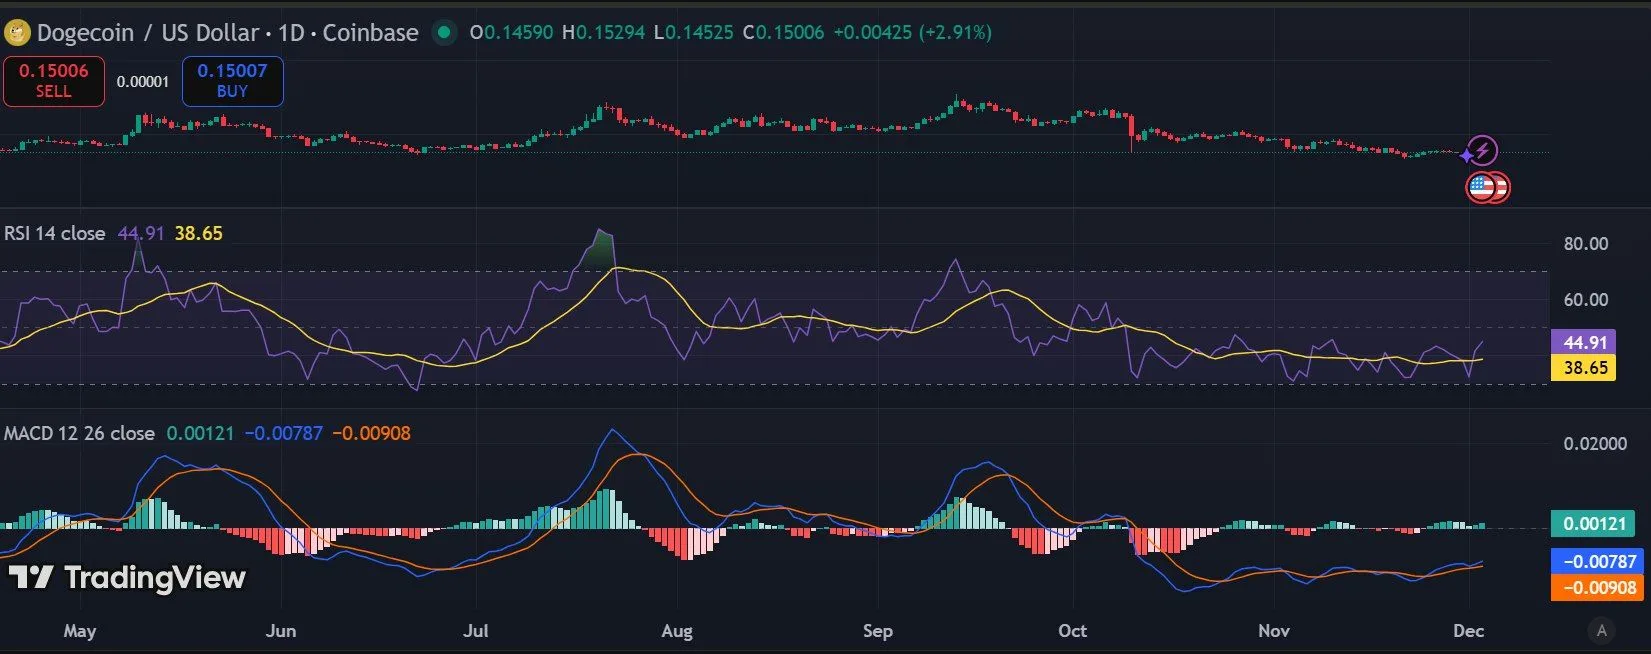
DOGE 1-day price chart, Source: TradingView
The relative strength indicator (RSI) sits around 44, indicating that the market is neither oversold nor overbought. The MACD remains slightly below the signal line, though both lines are flattening, suggesting that bearish momentum is fading and the market could be preparing for a potential shift.
