
Over the past week, Dogecoin showed a steady recovery, rising from around $0.140 to approximately $0.151. This represents a price increase of about 7.86%. The upward trend was marked by consistent buying pressure, with brief pullbacks before stabilizing near $0.151.
Dogecoin is trading around $0.151, down by 0.6%, showing a steady pullback after failing to hold above the $0.153–$0.154 area. This shows a weakening momentum, with sellers keeping pressure as the price forms lower highs.
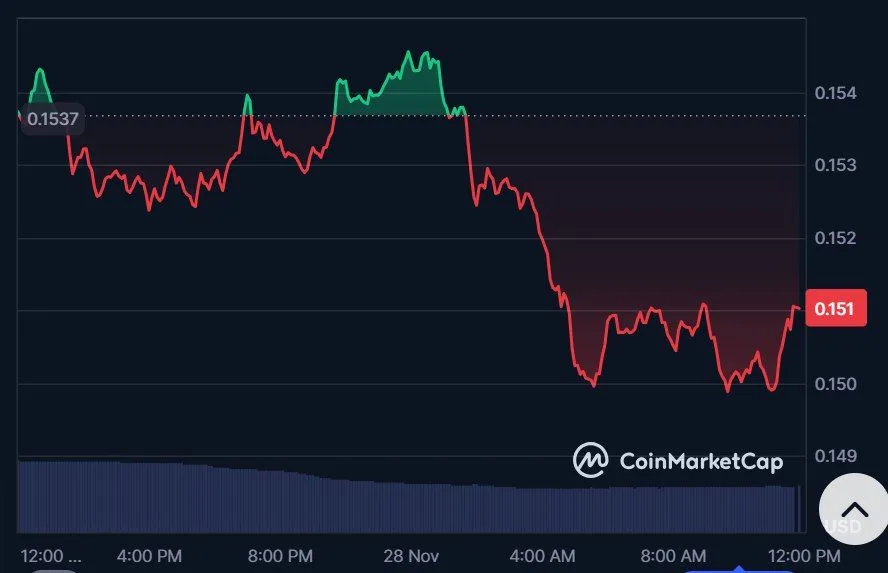
DOGE price chart, Source: CoinMarketCap
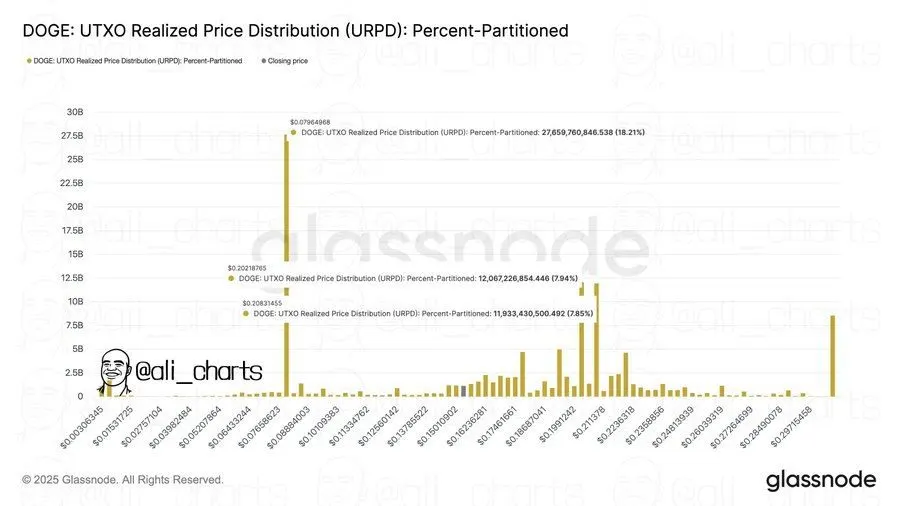
Major DOGE Accumulation Emerges Near the $0.20 Realized Price Level
According to recent data by Ali Martinez, the DOGE UTXO Realized Price Distribution chart reveals a dominant accumulation cluster around $0.074, where nearly 27.6 billion DOGE were last moved. This makes it the most critical realized price level in the current market structure.
Such a large concentration typically forms a strong support zone, as many holders share the same cost basis and are less likely to sell below it. Additional accumulation also appears near $0.002, representing long-term holders and early adopters who acquired DOGE at extremely low prices and continue to provide underlying market stability.
Source: X
The chart also highlights meaningful resistance zones forming at higher realized price levels, particularly around $0.20 and $0.29, where more than 12 billion DOGE and a sizable secondary cluster were last transacted. These levels suggest that a large segment of investors entered the market during previous rallies, and they may look to reduce exposure once the price revisits these areas. As analyst Ali Martinez often notes, these realized price concentrations serve as key psychological zones, helping determine where DOGE may face selling pressure or gather new bullish momentum.
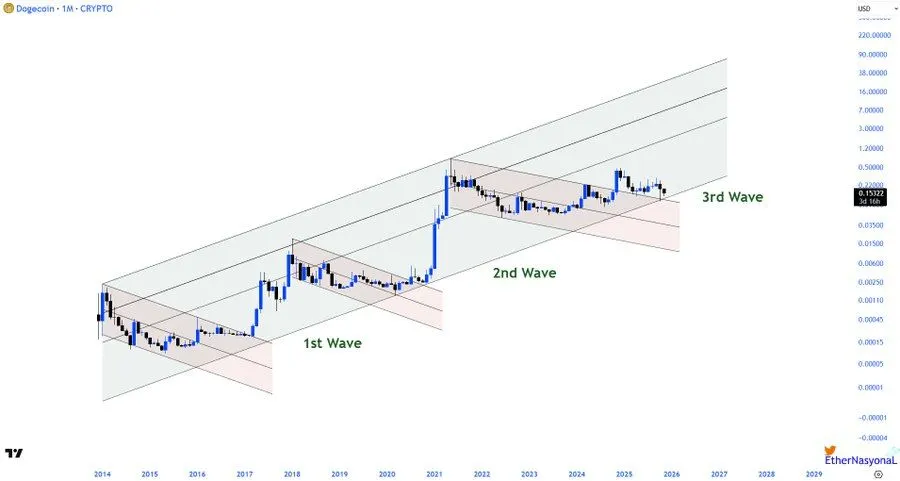
DOGE Awaits Breakout as the Third Wave Reaches a Critical Turning Point
The chart by analyst EᴛʜᴇʀNᴀꜱʏᴏɴᴀL illustrates Dogecoin’s long-term market structure through a series of expanding trend channels, highlighting three major historical waves. DOGE is currently navigating the third wave, but price action remains confined within a tight consolidation zone inside the upper portion of the channel.
This indicates that the market has not yet confirmed a decisive breakout, keeping momentum muted and preventing a clear shift toward a fully established bullish continuation. The structure reflects a period of indecision, where the asset is still respecting the broader upward channel but lacks the strength to push into a new expansion phase.
Source: X
According to the chart’s cyclical behavior, each completed wave has historically been followed by a significant breakout that defined the next macro trend. The ongoing third-wave deadlock suggests that the market is building pressure, awaiting a catalyst to confirm direction.
A breakout above the current consolidation band would signal renewed bullish strength and the potential start of the next surge, while failure to do so could extend the sideways phase or trigger a deeper retest of lower channel boundaries. In essence, the upcoming breakout will determine whether Dogecoin enters its next major growth cycle or remains stalled within its long-term structural pattern.
